Preview image. Unlock full-res
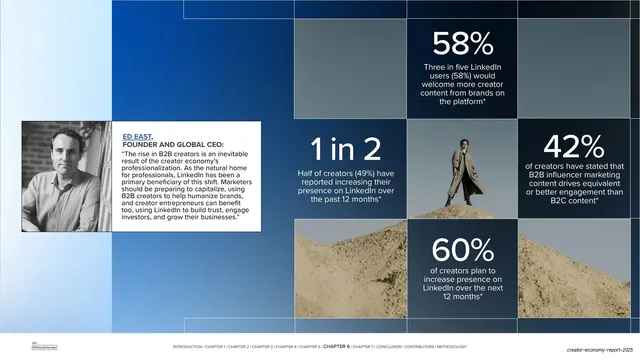
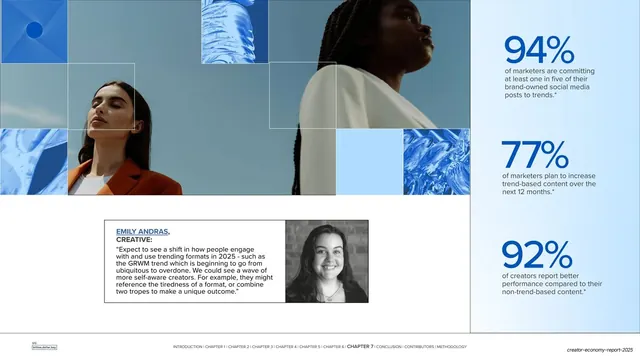
A wide data spread arranging four oversized LinkedIn stats and a quote block into a dark-tile mosaic grid with photographic squares interleaved.
Summary
A data spread built as a mosaic grid: four oversized LinkedIn statistics and an expert quote block tiled together with photographic squares, on a darker blue-tile field than the rest of the deck.
Visual description
The slide reads as a two-page spread. A grid of square cells mixes dark navy stat tiles, photographic tiles (a person standing on a sand mound), and a quote block. The stat tiles carry large white figures with captions: "58%", "1 in 2", "42%", and "60%", each describing LinkedIn creator behaviour. A white quote block at left holds a name and role in blue (Ed East, Founder and Global CEO), a quotation, and a black-and-white headshot. The left edge fades to a pale blue gradient. The chapter-nav footer runs along the bottom.
Key takeaway
Treating statistics as a bento mosaic: each number gets its own cell, interleaved with photo tiles and a quote, so a stat-heavy slide reads as one composed grid rather than a list. The darker navy grade signals "data section" while staying inside the deck's blue world.
Reuse notes
Strong when you have several standalone stats and want them to feel designed, not bulleted. The bento grid scales to more or fewer cells. Keep numbers white-on-navy for contrast and reserve one cell for an attributed quote to add a human voice.
From this deck: LinkedIn adoption stats mosaic spread
View deck

















More like this





Keep what you find
A free account saves references to boards and can send you a weekly email of picks based on what you save.
To see every result, go Pro.