Preview image. Unlock full-res
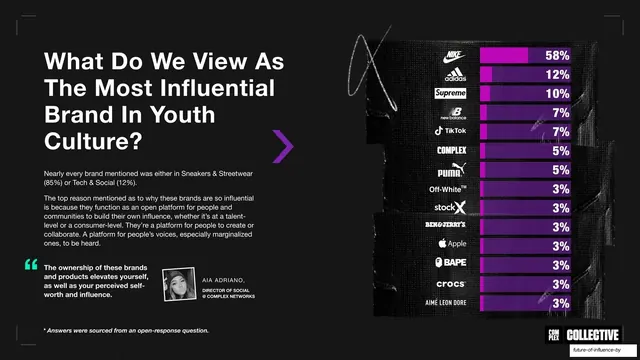
A ranked brand bar chart on torn black tape strips, each row a brand logo with a purple gradient bar and percentage, paired with a headline, analysis and pull quote.
Summary
A brand-ranking slide: the left column carries the question, analysis and a teal pull quote, while the right is a tall bar chart where each brand logo sits on a torn-tape row with a purple gradient bar and percentage.
Visual description
Dark grainy field. Left column: a bold white headline, "What Do We View As The Most Influential Brand In Youth Culture?", a large purple chevron, two paragraphs of analysis (Sneakers & Streetwear 85%, Tech & Social 12%), and a teal-quote-marked pull quote attributed to Aia Adriano, Director of Social @ Complex Networks, with a small framed headshot. Right column: a vertical stack of black torn-tape rows, each showing a brand logo in white (Nike 58%, adidas 12%, Supreme 10%, New Balance 7%, TikTok 7%, Complex 5%, Puma 5%, Off-White 3%, StockX 3%, Ben & Jerry's 3%, Apple 3%, BAPE 3%, Crocs 3%, Aime Leon Dore 3%), a short purple-to-violet gradient bar, and a right-aligned white percentage. A footnote bottom-left notes the open-response source. Complex / Collective lock-up bottom-right.
Key takeaway
Rendering each bar-chart row as the brand's own logo on a strip of torn gaffer tape, so a ranking doubles as a logo wall. The dominant value (Nike 58%) is obvious at a glance while the long tail of 3% brands still reads. Pairing the chart with a single human pull quote grounds the data.
Reuse notes
Excellent for brand-preference or share-of-mind rankings where the logos themselves carry recognition. Needs clean monochrome logo lock-ups and works only on a dark, textured ground. Fourteen rows is near the ceiling for one slide; beyond that, split or shrink to a two-column list.
From this deck: Most influential brand ranked bar chart with logos
View deck




More like this





Keep what you find
A free account saves references to boards and can send you a weekly email of picks based on what you save.
To see every result, go Pro.