Preview image. Unlock full-res
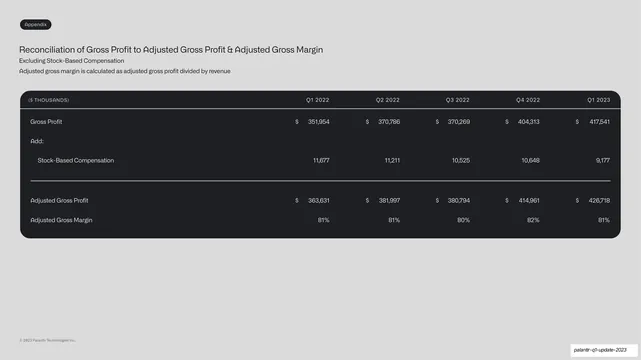
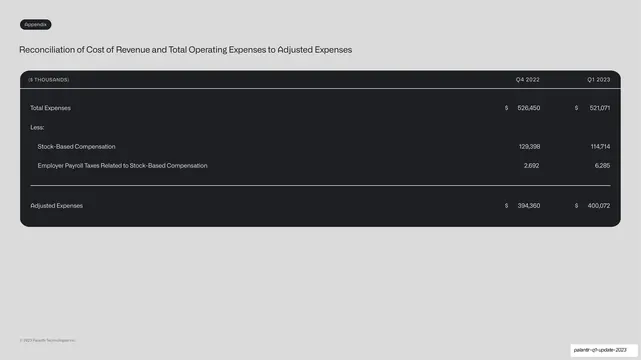
An appendix reconciliation table in a dark panel walking gross profit to adjusted gross profit and margin across five quarters.
Summary
An appendix reconciliation table walking from gross profit to adjusted gross profit and adjusted gross margin across five quarters.
Visual description
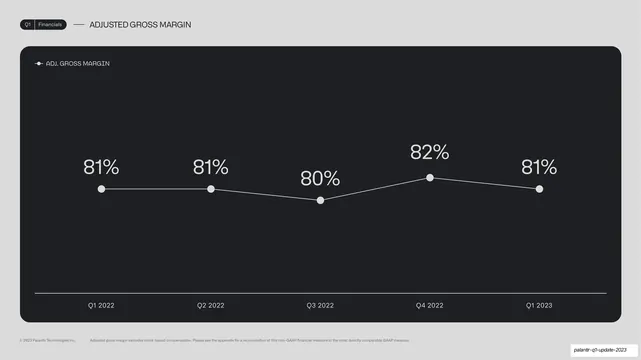
Light-grey background, "Appendix" pill tab top-left, with the table title and two quiet method sub-lines above. A wide near-black rounded panel holds a five-column table (Q1 2022 through Q1 2023) with a monospace "($ THOUSANDS)" header. Rows: Gross Profit, an "Add:" line with an indented Stock-Based Compensation add-back, a hairline rule, then Adjusted Gross Profit and an Adjusted Gross Margin percentage row. All figures right-aligned with dollar signs; the margin row shows 81%/81%/80%/82%/81%.
Key takeaway
The same reconciliation grammar extended to five quarters, showing how the dark-panel table scales horizontally while keeping the Add-line-plus-indent-plus-subtotal logic intact. Carrying a percentage row beneath the dollar subtotal ties the table back to the chart earlier in the deck.
Reuse notes
Reuse for multi-period reconciliations. Keeping the row structure identical to the other appendix tables lets a reader move between them effortlessly. The trailing margin row is a nice bridge between a reconciliation and the headline chart it supports.
From this deck: Gross profit reconciliation table
View deck




More like this




Keep what you find
A free account saves references to boards and can send you a weekly email of picks based on what you save.
To see every result, go Pro.