Preview image. Unlock full-res
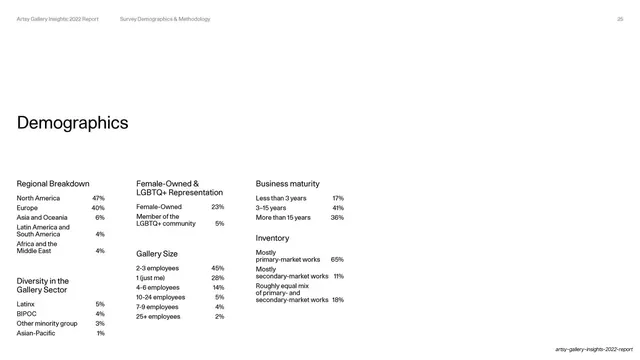
A clean white demographics slide with the headline lower-left and six labeled percentage lists arranged in a three-column grid.
Summary
A respondent demographics slide: the word "Demographics" lower-left as the headline, with six small sub-headed percentage lists (regional breakdown, diversity, female-owned/LGBTQ+, gallery size, business maturity, inventory) laid out in a three-column grid.
Visual description
Plain white slide, utility header page 25. The headline "Demographics" sits in the lower-left third in medium black sans. To its right and across the slide, six labeled groups are arranged in three columns: each has a small bold sub-heading (Regional Breakdown, Diversity in the Gallery Sector, Female-Owned & LGBTQ+ Representation, Gallery Size, Business maturity, Inventory) followed by a short list of items with right-aligned percentages. All type is small and black; alignment and column spacing organize the grid with no rules or color.
Key takeaway
Packing six related mini-tables into one tidy three-column grid so an entire demographic profile fits on a single slide. Consistent sub-headings and right-aligned percentages make the dense data scannable, and placing the lone headline low-left balances the busy right side.
Reuse notes
The right pattern for an appendix or methodology demographics slide where many small breakdowns must coexist. Reusable wherever you have several short labeled lists. Keep sub-headings uniform and percentages right-aligned per column; rely on whitespace, not borders, to separate the groups.
From this deck: Demographics breakdown
View deck















More like this


Keep what you find
A free account saves references to boards and can send you a weekly email of picks based on what you save.
To see every result, go Pro.