
Preview image. Unlock full-res
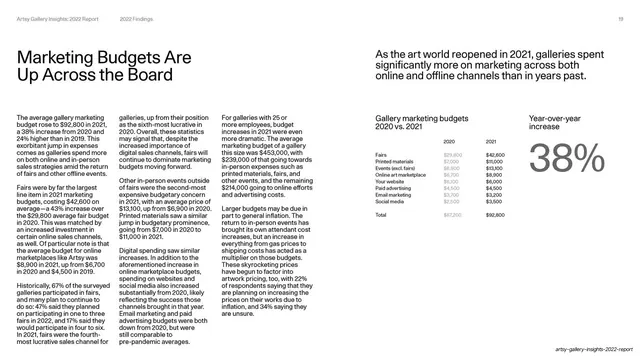
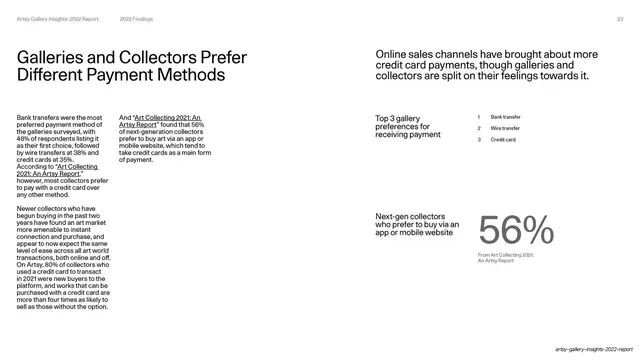
A findings deep-dive with a headline and two-column body on the left and a three-bar block chart (67/74/77 percent) of solid color rectangles on the right.
Summary
A deep-dive on price transparency: headline and three-column body on the left, and on the right a takeaway line above a three-bar block chart showing 67%, 74%, 77% across 2019-2021.
Visual description
White slide, utility header "2022 Findings", page 13. Left: headline "Price Transparency Is Becoming the Norm" in medium black sans, with three narrow columns of small justified body copy (one underlined inline link). Right: a takeaway sentence "Visible pricing is upending the status quo as galleries embrace online sales and attempt to attract new collectors", the metric label "% of galleries making prices visible on at least some of their works sold online", then three vertical bars on faint gray tracks, each a solid color rectangle (cornflower blue, yellow, peach) with a large percentage inside and a year caption below (2019, 2020, 2021).
Key takeaway
Using the block-bar chart to show a rising three-year trend, where the gentle step-up in bar heights plus the climbing percentages tells the growth story at a glance. Three columns of body text balance the chart without crowding it.
Reuse notes
Reuse for any short time-series of three to four points where the trend is the message. The consistent chart treatment across the findings section means readers already know how to read it. Order bars left-to-right by year and keep the year labels anchored at the bottom.
From this deck: Price Transparency Is Becoming the Norm
View deck
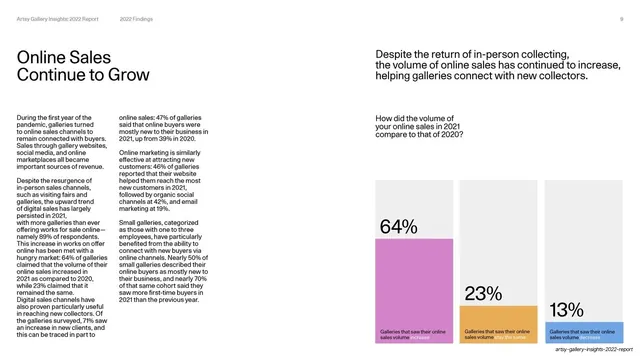
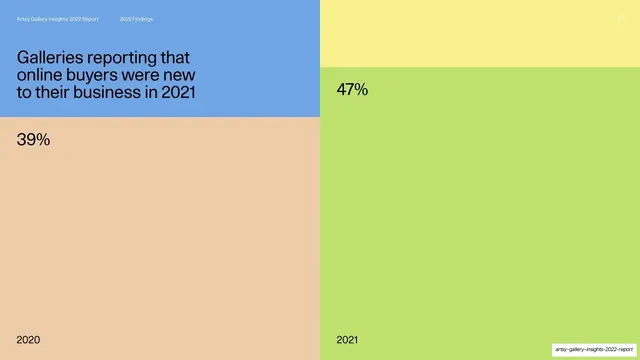

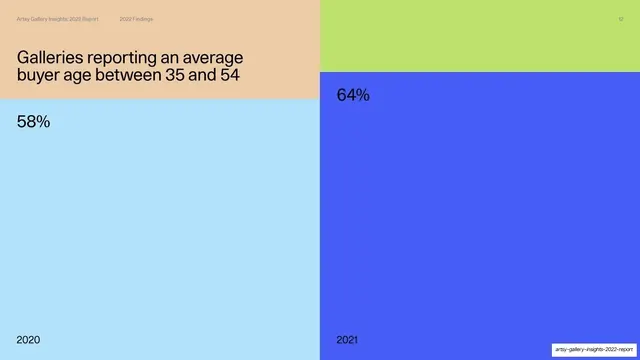
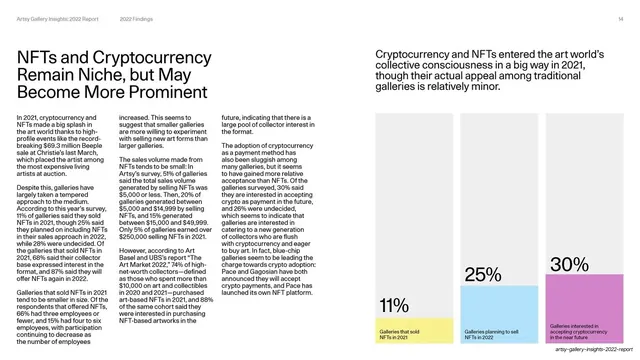
More like this





Keep what you find
A free account saves references to boards and can send you a weekly email of picks based on what you save.
To see every result, go Pro.