Preview image. Unlock full-res
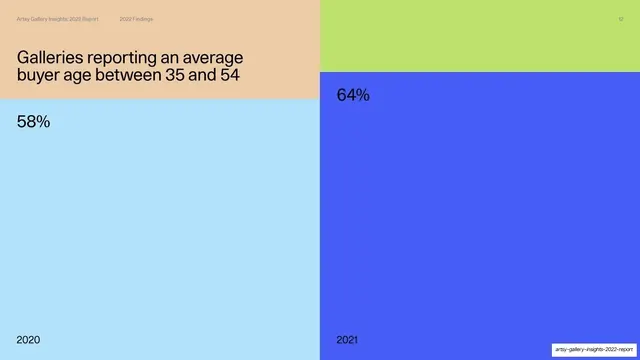
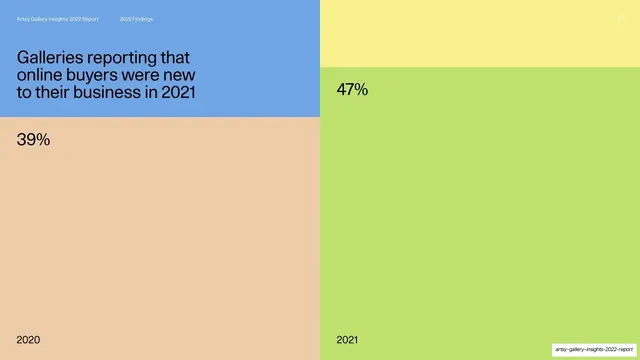
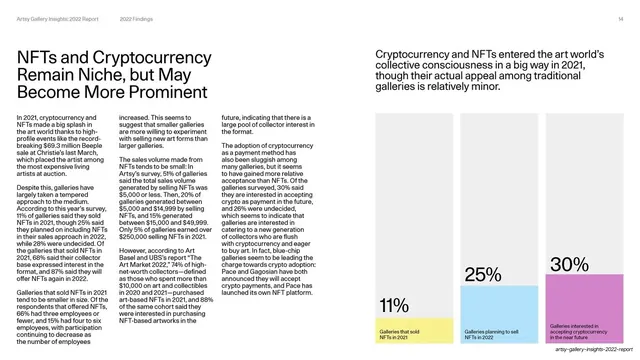
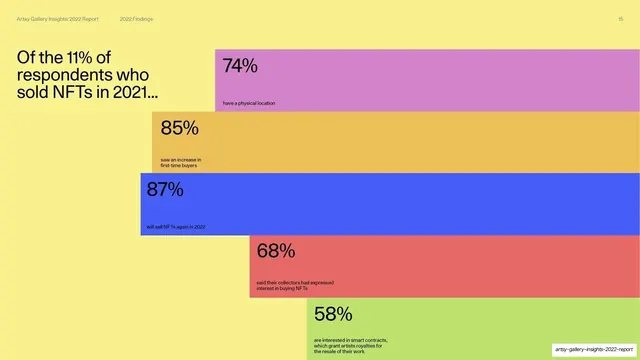
A full-bleed stat slide comparing two years as large color blocks, 58% on a sky-blue 2020 panel and 64% on a cornflower-blue 2021 panel.
Summary
A two-year comparison as full-bleed color: the left half (sky-blue) shows 58% for 2020, the right half (cornflower-blue) shows 64% for 2021, both labeled as galleries reporting an average buyer age between 35 and 54.
Visual description
The slide is filled by large flat color rectangles. The left column is a tall sky-blue block with "58%" near the top in black and "2020" at the bottom; the right column is a tall cornflower-blue block with "64%" and "2021". A peach band runs across the top-left carrying the headline "Galleries reporting an average buyer age between 35 and 54", and a lime band sits across the top-right. Type is black throughout.
Key takeaway
The same poster-like two-column comparison as the earlier year-over-year slide, here in two blues, showing how the template flexes within a single hue family while the layout stays identical. Repeating the format builds a rhythm the audience learns to read.
Reuse notes
Reuse as a sibling to the deck's other two-panel comparison slides. Choosing two shades of one color (rather than two different hues) is a good option when the two periods measure the same metric. Keep the larger number on the right "now" panel to imply direction.
From this deck: Average buyer age 35-54, 2020 vs 2021 (58% / 64%)
View deck









More like this



Keep what you find
A free account saves references to boards and can send you a weekly email of picks based on what you save.
To see every result, go Pro.