Preview image. Unlock full-res
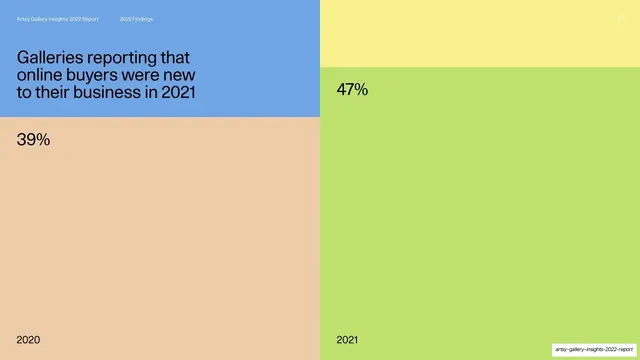
A full-bleed stat slide comparing two years as large color blocks, 39% on a peach 2020 panel and 47% on a green 2021 panel.
Summary
A two-year comparison rendered as full-bleed color: the left half (peach) shows 39% for 2020, the right half (green) shows 47% for 2021, both labeled with the share of galleries reporting online buyers new to their business.
Visual description
The whole slide is filled by large flat color rectangles. The left column is a tall peach block with "39%" set large near the top in black and "2020" at the bottom; the right column is a tall lime-green block with "47%" and "2021". A blue band across the top-left carries the question headline "Galleries reporting that online buyers were new to their business in 2021", and a yellow band sits across the top-right. The percentages and labels are black throughout.
Key takeaway
Comparing two periods by giving each its own full-height color column and a single huge number. The relative values read instantly, and the slide becomes almost a poster. The taller/greener "now" column quietly signals growth without a chart axis.
Reuse notes
A dramatic alternative to a two-bar chart for any before/after or year-over-year comparison. Reusable wherever a single headline number per period carries the story. Use distinct palette colors per period and keep the year labels anchored to the bottom edge for a clean read.
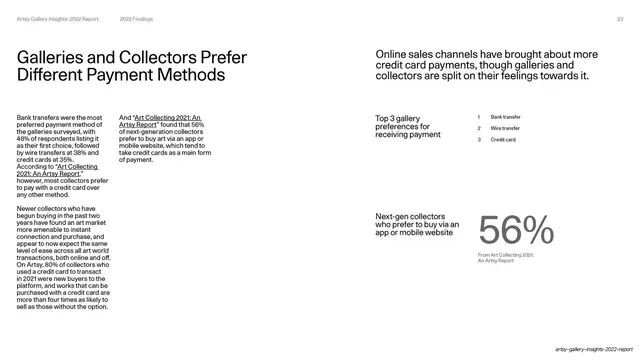
From this deck: New online buyers, 2020 vs 2021 (39% / 47%)
View deck







More like this




Keep what you find
A free account saves references to boards and can send you a weekly email of picks based on what you save.
To see every result, go Pro.