Preview image. Unlock full-res
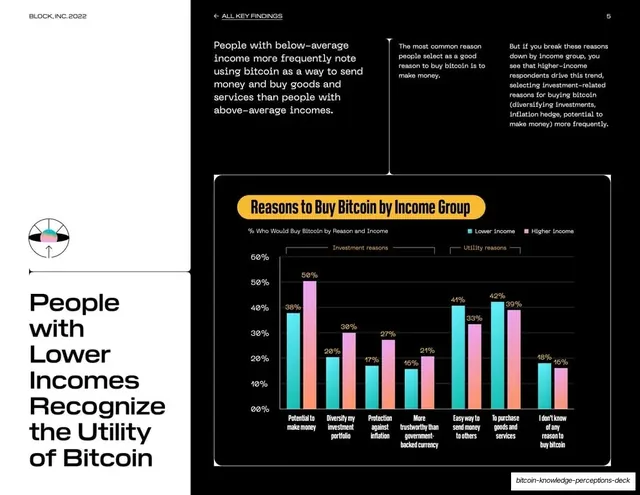
White data slide with a left-rail headline and a dark panel holding a teal-and-pink grouped bar chart of reasons to buy bitcoin by income group.
Summary
A data slide pairing a tall left-rail headline with a dark panel chart comparing reasons lower- and higher-income people would buy bitcoin.
Visual description
White background with a wide black panel on the right. The bottom-left rail holds the headline "People with Lower Incomes Recognize the Utility of Bitcoin" in large black grotesque, broken across many short lines, above a small holographic circular icon. Two columns of small body copy run along the top of the black panel. The lower-right is a dark rounded data panel titled in a yellow pill, "Reasons to Buy Bitcoin by Income Group", with a sub-caption. Inside, a grouped bar chart plots seven reasons (potential to make money, diversify portfolio, protection against inflation, and so on) with teal bars for lower income and pink bars for higher income, each bar carrying a percentage label, split under bracketed "Investment reasons" and "Utility reasons" headers.
Key takeaway
The repeating data-slide template: oversized broken headline bottom-left, two-column setup copy across the top, and a self-contained dark chart panel with a yellow pill title. The teal/pink two-series coding is consistent across every chart in the deck.
Reuse notes
A directly reusable layout for any survey or comparison finding: one big takeaway headline, supporting copy, and one labeled chart. The yellow pill title and dark panel keep charts legible and branded. Best when each chart carries explicit data labels as here.
From this deck: Reasons to buy bitcoin by income, grouped bar chart
View deck




More like this






Keep what you find
A free account saves references to boards and can send you a weekly email of picks based on what you save.
To see every result, go Pro.