Preview image. Unlock full-res
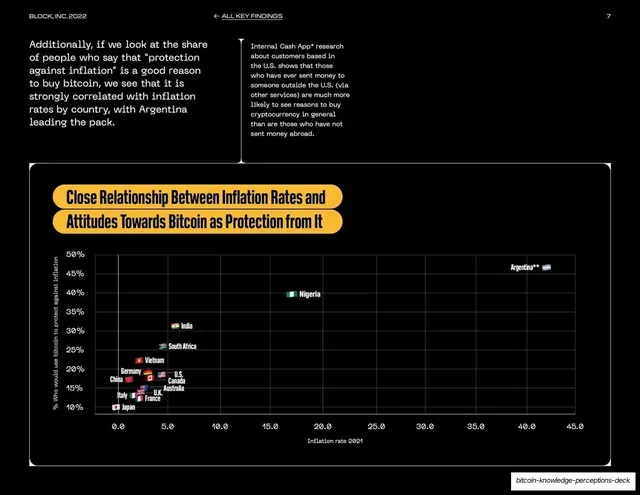
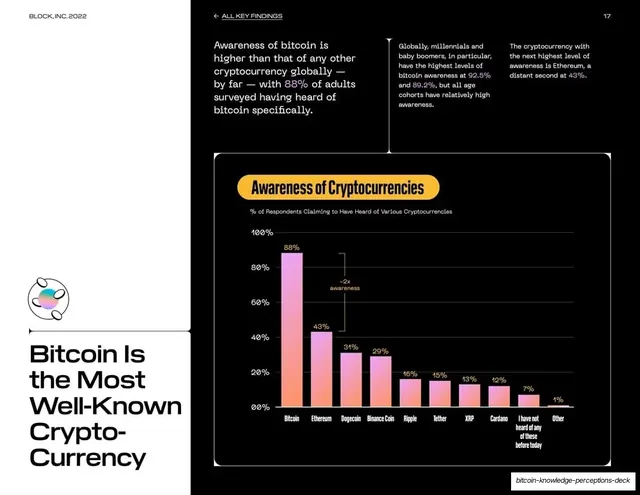
White data slide with intro copy over a single wide dark scatter-plot panel relating inflation rates to bitcoin-as-protection attitudes, plotted with country flags.
Summary
A data slide built around one wide dark scatter panel that relates a country's 2021 inflation rate to how many respondents see bitcoin as inflation protection.
Visual description
White background. Two short text columns at the top: a headline about "protection against inflation" being correlated with inflation rates, with Argentina leading, beside a column of caveat copy referencing internal Cash App research. The lower portion is a single wide dark rounded data panel titled in a yellow pill "Close Relationship Between Inflation Rates and Attitudes Towards Bitcoin as Protection from It". Inside, percentage who would use bitcoin to protect against inflation is plotted against 2021 inflation rate, with country flags (Argentina far right, Nigeria, India, South Africa, Vietnam, and a tight cluster of developed economies bottom-left) as points on a light grid.
Key takeaway
Going wide with a single scatter panel when one correlation is the whole point of the slide, giving the data room to breathe. The consistent flags-as-points convention again removes the need for a legend.
Reuse notes
Use when one chart deserves the full slide width rather than being twinned. Carries less body copy, so the takeaway must live in the headline and the chart. Footnoted caveats (the asterisks here) belong in the side column, keeping the panel clean.
From this deck: Inflation and bitcoin attitudes, wide scatter plot
View deck

More like this







Keep what you find
A free account saves references to boards and can send you a weekly email of picks based on what you save.
To see every result, go Pro.