Preview image. Unlock full-res
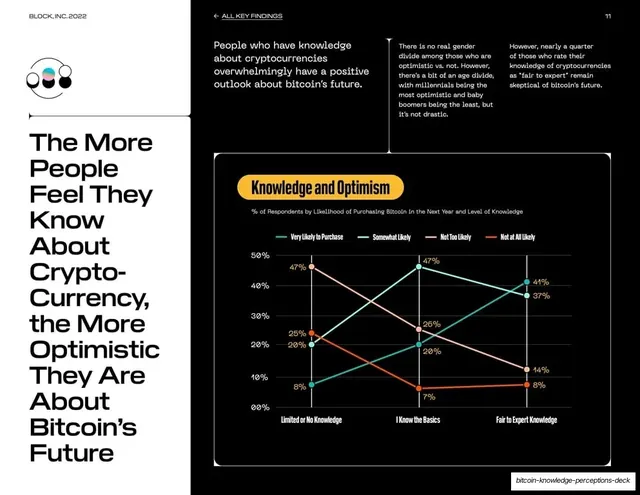
White data slide with a very tall left-rail headline and a dark panel holding a four-series line chart linking crypto knowledge level to likelihood of purchasing bitcoin.
Summary
A data slide with one of the deck's tallest headlines beside a dark panel line chart showing purchase likelihood rising with crypto knowledge.
Visual description
White background with a wide black panel right. The bottom-left rail carries the headline "The More People Feel They Know About Crypto-Currency, the More Optimistic They Are About Bitcoin's Future" in large black grotesque, broken across roughly twelve short lines and filling the left column, above a small holographic icon. Three columns of body copy run across the top. The lower-right dark panel, titled in a yellow pill "Knowledge and Optimism", plots four purchase-likelihood series (very likely, somewhat likely, not too likely, not at all likely) in teal, pink, and warm tones across three knowledge levels on the x-axis, every node carrying a percentage label, with a top legend.
Key takeaway
The crossing-lines chart that makes a relationship visceral: as knowledge rises left to right, the "very likely" line climbs while "not at all likely" falls, and the X they form is the argument. Pairing it with a headline that states the same conclusion in words.
Reuse notes
Multi-series line charts work when the crossing or diverging shape is itself the message; label every node so values survive at slide scale. The four-color series reuse the deck palette. Reserve the very tall headline for findings strong enough to justify the space.
From this deck: Knowledge and optimism, line chart
View deck
More like this


Keep what you find
A free account saves references to boards and can send you a weekly email of picks based on what you save.
To see every result, go Pro.