Preview image. Unlock full-res
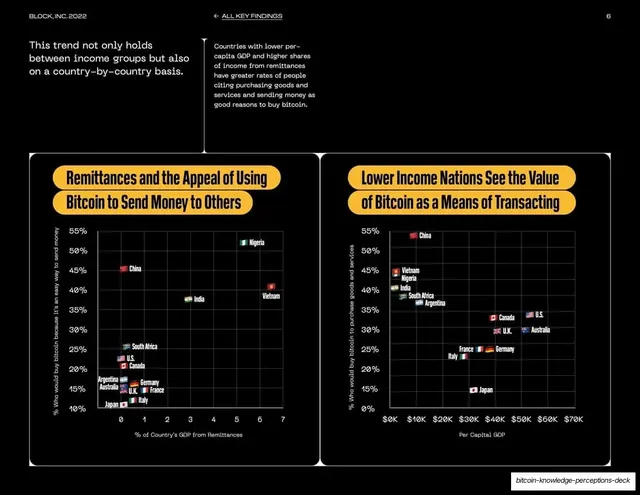
White data slide with intro copy over two side-by-side dark scatter-plot panels mapping bitcoin attitudes against GDP and remittances, using country flags as points.
Summary
A data slide using two side-by-side dark scatter plots, with country flags as data points, to relate bitcoin sentiment to remittances and per-capita GDP.
Visual description
White background. A short headline at the top left, "This trend not only holds between income groups but also on a country-by-country basis", sits beside a column of supporting copy. The lower two-thirds is split into two dark rounded data panels. The left panel, titled in a yellow pill "Remittances and the Appeal of Using Bitcoin to Send Money to Others", plots percentage who find bitcoin an easy way to send money against share of GDP from remittances. The right panel, "Lower Income Nations See the Value of Bitcoin as a Means of Transacting", plots willingness to buy bitcoin for goods and services against per-capita GDP. Both use small country flags (Nigeria, China, India, Vietnam, U.S., and others) as scatter points on light gridlines.
Key takeaway
Using country flags as scatter-plot markers, which makes a dense correlation chart instantly readable without a legend. Twinning two related scatter panels side by side lets one slide carry two findings under a shared takeaway.
Reuse notes
Great for global or cross-market data where nationality is the key dimension. Flags-as-points only works with a manageable country count and decent resolution. The twin-panel layout suits paired correlations; the yellow pill titles keep both charts labeled consistently.
From this deck: Remittances and transacting, twin scatter plots
View deck


More like this









Keep what you find
A free account saves references to boards and can send you a weekly email of picks based on what you save.
To see every result, go Pro.