Preview image. Unlock full-res
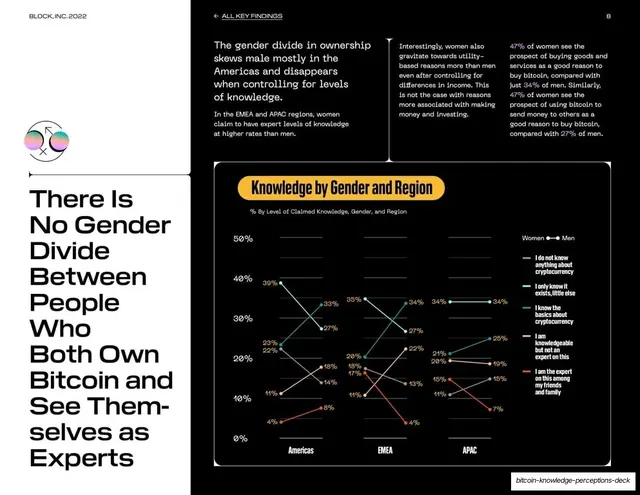
White data slide with a tall left-rail headline and a dark panel of three slope/connected-line charts comparing claimed knowledge by gender across Americas, EMEA, and APAC.
Summary
A data slide pairing a very tall left-rail headline with a dark panel of three small slope charts comparing women's and men's claimed knowledge across regions.
Visual description
White background with a wide black panel right. The bottom-left rail carries an unusually tall headline, "There Is No Gender Divide Between People Who Both Own Bitcoin and See Themselves as Experts", broken across roughly eleven short lines and nearly filling the left column, above a small holographic icon. Three columns of body copy run across the top of the black area. The lower-right dark panel, titled in a yellow pill "Knowledge by Gender and Region", holds three small connected-dot slope charts (Americas, EMEA, APAC), each line tracking a knowledge level with teal and pink endpoint dots and percentage labels, against a right-hand legend of five knowledge tiers and a Women/Men key.
Key takeaway
The slope/connected-dot chart for showing men-vs-women movement across a few categories within three regions at once, compactly. And the deck's habit of letting the headline grow as tall as the finding needs, here filling the entire left rail.
Reuse notes
Slope charts shine for before/after or group-A-vs-group-B comparisons across a handful of items; three small multiples make the regional pattern legible side by side. Needs clear endpoint labels to read at slide scale. The oversized headline works because the chart carries the proof.
From this deck: Knowledge by gender and region, slope chart
View deck


More like this






Keep what you find
A free account saves references to boards and can send you a weekly email of picks based on what you save.
To see every result, go Pro.