
Preview image. Unlock full-res
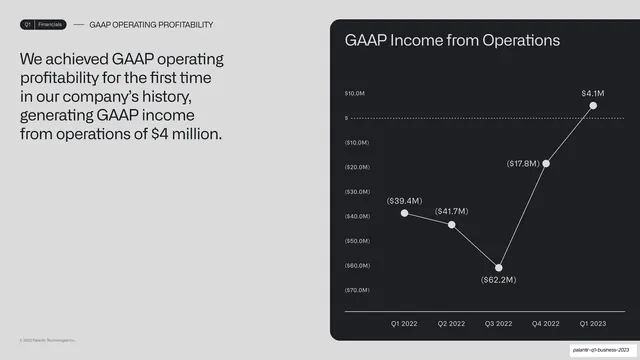
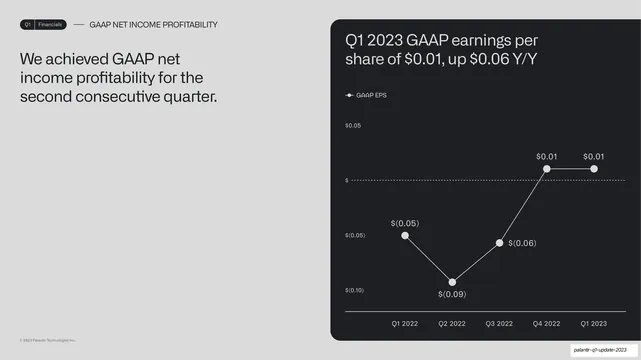
A headline-left, chart-right split: GAAP net income claim on the left, and a five-quarter GAAP EPS line chart crossing zero inside a dark card on the right.
Summary
A net-income proof slide: the GAAP profitability claim on the left, a five-quarter GAAP EPS line chart that climbs across the zero line on the right.
Visual description
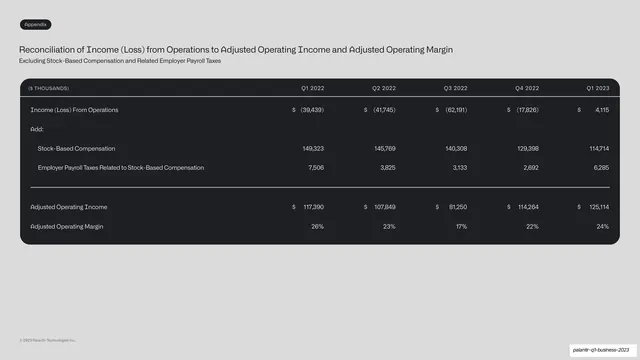
A light grey slide. Running header shows "Q1 | Financials" and "GAAP NET INCOME PROFITABILITY". The left third holds a dark three-line headline about achieving GAAP net income profitability for the second consecutive quarter. The right two-thirds is a rounded near-black card titled "Q1 2023 GAAP earnings per share of $0.01, up $0.06 Y/Y". Inside, a white line chart plots GAAP EPS across Q1 2022 through Q1 2023, with circular white nodes and value labels ($(0.05), $(0.09), $(0.06), $0.01, $0.01); a dotted horizontal line marks the zero baseline, and the line rises from negative into positive. A small monospace "GAAP EPS" legend sits top-left of the chart.
Key takeaway
The headline-left, chart-in-dark-card-right split that is the deck's workhorse layout. The dotted zero baseline turns a simple line chart into a profitability story, the crossover point doing the narrative work.
Reuse notes
The canonical metric-trend slide for this deck and a reusable pattern for any earnings or KPI chart. The dark chart card on a light slide gives every chart the same frame. Use the dotted baseline whenever crossing a threshold (zero, breakeven, target) is the point.
From this deck: GAAP net income profitability line chart
View deck













More like this





Keep what you find
A free account saves references to boards and can send you a weekly email of picks based on what you save.
To see every result, go Pro.