Preview image. Unlock full-res
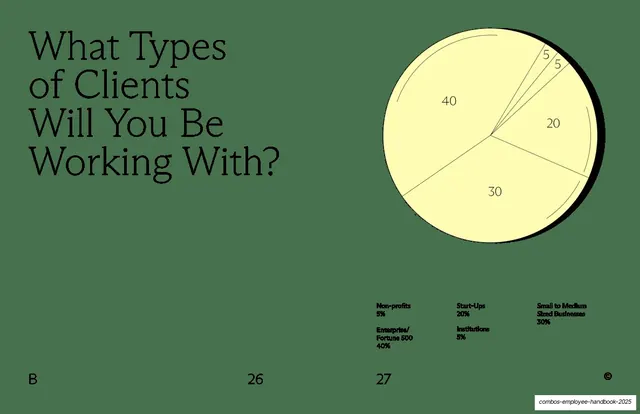
Green data spread with a serif "What Types of Clients Will You Be Working With?" question left and a yellow pie chart with a legend of client segments right.
Summary
A client-mix spread: a serif question on the left, a single yellow pie chart broken into client-type slices with a small legend underneath on the right.
Visual description
Full-bleed sage-green, near-black type. The left page asks "What Types of Clients Will You Be Working With?" in the light humanist serif across four lines. The right page holds one pie chart filled entirely in butter yellow, divided by thin black radial lines into segments labeled with bare percentages inside (40, 30, 20, 5, 5) and lifted by a subtle black drop shadow behind the circle. Below the chart, a three-column legend in small bold sans maps the slices: Non-profits 5%, Enterprise/Fortune 500 40%, Start-Ups 20%, Institutions 5%, Small to Medium Sized Businesses 30%. Section letter "B" bottom-left, page numbers "26" and "27", circled-© bottom-right.
Key takeaway
A monochrome pie chart that uses only the brand yellow plus hairline dividers, with the percentage numbers set inside the slices and a tidy multi-column legend below, so a data graphic stays fully on-palette. The single drop shadow gives the flat chart just enough lift.
Reuse notes
A reusable approach for the one or two data moments in an otherwise text-led deck: keep the chart to brand colors and let typography carry the labels. Good for breakdowns, splits, and proportions. With more than a handful of segments the single-color fill would stop being legible; this works because the slices are few.
From this deck: Types of Clients pie chart
View deck




More like this




Keep what you find
A free account saves references to boards and can send you a weekly email of picks based on what you save.
To see every result, go Pro.