Preview image. Unlock full-res
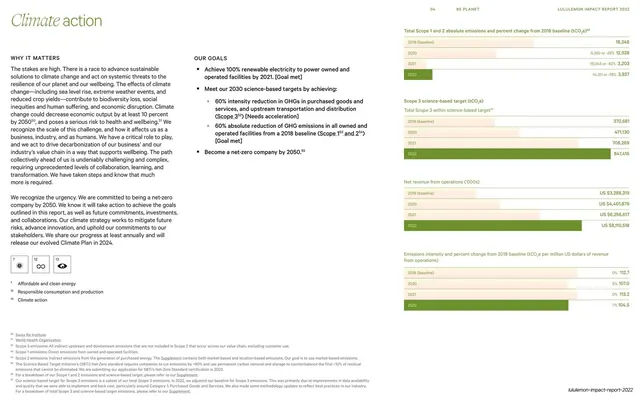
A "Climate action" page pairing two columns of why-it-matters and goals copy with four right-side horizontal bar charts of emissions and revenue metrics on a pale green field.
Summary
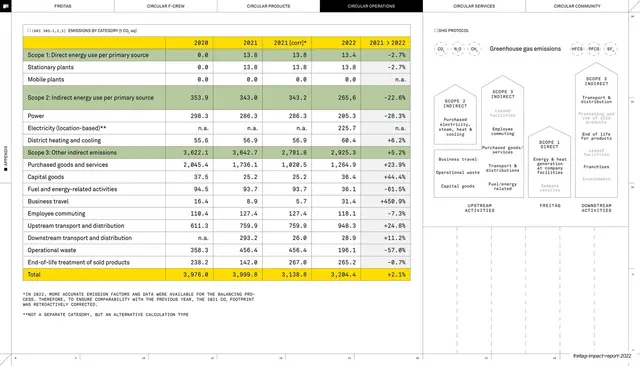
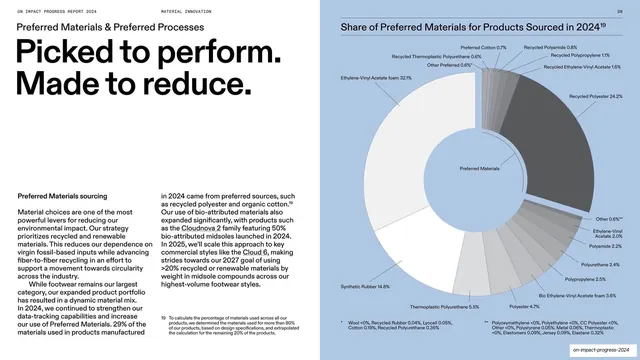
A data-and-narrative spread: "Climate action" heads two columns of "Why it matters" and "Our goals" copy on the left, with a right rail of four small horizontal bar charts tracking emissions and revenue from 2018 to 2022.
Visual description
Pale green-cream background, standard running header across the top. Top-left, the title "Climate action" pairs a roman and italic serif word in olive green. Beneath, two columns: a left "Why it matters" narrative in small sans-serif and a right "Our goals" bulleted list. A right-hand column stacks four labeled mini bar charts, each a small all-caps title (e.g. "Total Scope 1 and 2 absolute emissions...", "Net revenue from operations", "Emissions intensity...") above 2018-2022 rows of olive-green horizontal bars with right-aligned values and year-over-year percent deltas. A dense numbered footnote block runs along the bottom; wordmark bottom-right.
Key takeaway
Splitting a content page into argument (left columns) and evidence (right data rail), so qualitative and quantitative live together without one burying the other. The uniform mini-bar treatment lets several metrics share a column at a glance.
Reuse notes
Ideal for ESG, sustainability, or financial report pages that must show both story and figures. The consistent green monochrome keeps multiple charts calm and comparable. The small bars and heavy footnotes suit print or PDF; enlarge for live presentation. Reuse the right-rail-of-mini-charts pattern across a data chapter for consistency.
From this deck: Climate action narrative with right-aligned data bars
View deck








More like this

Keep what you find
A free account saves references to boards and can send you a weekly email of picks based on what you save.
To see every result, go Pro.