Preview image. Unlock full-res
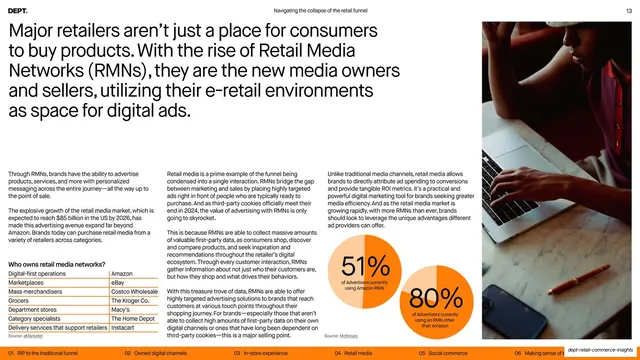
A big RMN statement over body columns, a two-column table of retail media networks, two orange donut stats, and a small inline photo.
Summary
A data-heavy slide: a top statement about Retail Media Networks, columns of body text, a "Who owns retail media networks?" two-column table, two large orange donut charts (51% and 80%), and a small inline laptop photo.
Visual description
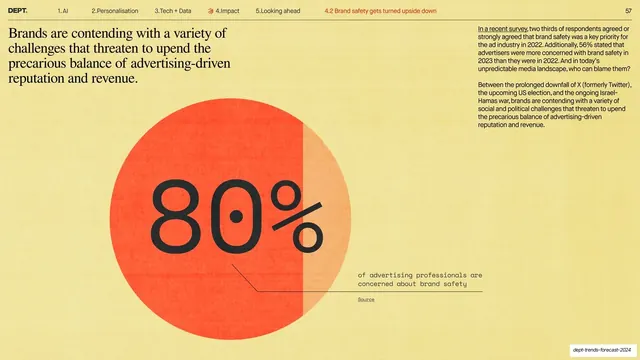
The top carries a black statement, "Major retailers aren't just a place for consumers to buy products. With the rise of Retail Media Networks (RMNs), they are the new media owners and sellers." Below it, several columns of body copy include the highlighted "$85 billion" figure. A small two-column reference table headed "Who owns retail media networks?" pairs categories (Marketplaces, Grocers, Department stores) with examples (eBay, The Kroger Co., Macy's). At the lower right, two overlapping orange-and-amber donut charts read "51% of advertisers using Amazon RMN" and "80% of advertisers currently using an RMN other than Amazon," beside a small photo of a person at a laptop. The standard running header and orange chapter-strip footer frame the slide.
Key takeaway
Flat orange donut charts with the big percentage set inside, used as punchy stat callouts rather than precise data viz. Combined with a compact two-column reference table, the slide packs statement, evidence, and proof points without feeling cluttered.
Reuse notes
Good for a data slide that has to land a couple of headline stats plus a short reference list. The donut-with-big-number treatment is reusable for any single-figure stat; keep to the accent palette. Mind density, this slide carries a statement, body copy, a table, two charts, and a photo, near the ceiling for one page.
From this deck: Retail Media Networks statement with stat donuts and table
View deck










More like this




Keep what you find
A free account saves references to boards and can send you a weekly email of picks based on what you save.
To see every result, go Pro.