Preview image. Unlock full-res
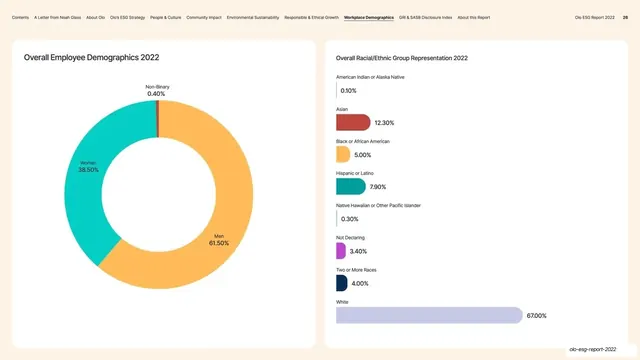
Light demographics page with two white cards, a gender donut chart on the left and a racial/ethnic group horizontal-bar list on the right.
Summary
A two-card demographics page: a gender donut chart on the left and a racial/ethnic group representation list of horizontal bars on the right, both in white rounded cards.
Visual description
Warm off-white background, persistent top navigation (page 26). Two equal rounded white cards fill the page. The left card, "Overall Employee Demographics 2022", holds a thick donut chart split into Men 61.50% (amber), Women 38.50% (teal), and a sliver of Non-Binary 0.40% (rust), each labeled around the ring. The right card, "Overall Racial/Ethnic Group Representation 2022", lists nine categories top to bottom (American Indian, Asian, Black, Hispanic, Native Hawaiian, Not Declaring, Two or More Races, White), each a short colored horizontal bar scaled to its percentage with the value to the right; White (67.00%) runs nearly the full width.
Key takeaway
Splitting a two-dimension demographic story across one donut (for a clean three-way split) and one ranked bar list (for many categories) so each chart type does what it is best at. The bar list scaled to width gives an instant sense of dominance (White at 67%) without reading every number.
Reuse notes
Reusable for any "by gender / by group" breakdown page. The donut suits 2 to 4 slices; beyond that it gets unreadable, which is exactly why the racial/ethnic data uses bars instead. Keep both inside the report's standard white card to stay consistent with neighboring pages.
From this deck: Overall Demographics donut and bar-list cards
View deck







More like this




Keep what you find
A free account saves references to boards and can send you a weekly email of picks based on what you save.
To see every result, go Pro.