
Preview image. Unlock full-res
Facts and highlights spread on the new Munich repair station and S.W.A.P. events, with a workshop photo lower-left and a repairs bar chart lower-right.
Summary
A "FACTS & HIGHLIGHTS 2022" services spread: an oversized headline and workshop photo on the left, a "NEW REPAIR STATION MUNICH" text block in the centre with a number-of-repairs bar chart, and a "LOCAL S.W.A.P. EVENTS" text column on the right.
Visual description
The six-tab header runs across the top with CIRCULAR SERVICES inverted. Top-left carries the large two-line "FACTS & HIGHLIGHTS 2022" headline; below it a color photograph of a worker at a repair bench fills the lower-left. The centre, marked by a circled icon, holds the "NEW REPAIR STATION MUNICH" heading, body text, and a "NUMBER OF REPAIRS: YEAR-ON-YEAR COMPARISON" chart of three yellow bars (2020, 2021, 2022) annotated with figures on a hairline grid. The right column, also icon-marked, has the "LOCAL S.W.A.P. EVENTS" heading over justified text. Hairline rules and a faint ruler frame the page; deck-slug footer bottom-right.
Key takeaway
Reusing the same "FACTS & HIGHLIGHTS 2022" oversized-headline masthead across different chapters, so recurring data spreads are instantly recognisable. Combining a single supporting photo, a short metric chart, and explanatory text in one balanced three-part page.
Reuse notes
A repeatable highlights-page template for any report that surfaces a few notable facts per section. The single-color (yellow) bar chart keeps simple year-on-year data clean. Works best with one strong supporting photo plus one small chart, not multiples.
From this deck: Repair station Munich facts and highlights
View deck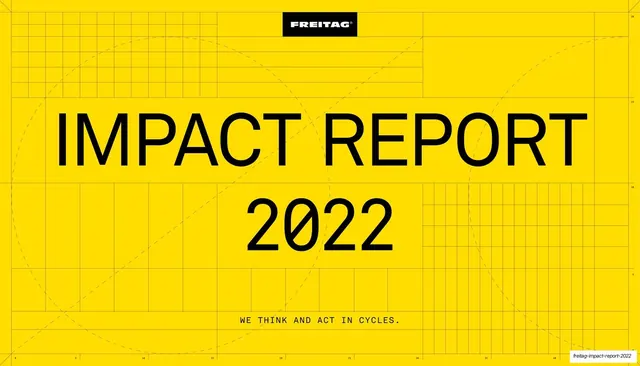
More like this





Keep what you find
A free account saves references to boards and can send you a weekly email of picks based on what you save.
To see every result, go Pro.