Preview image. Unlock full-res
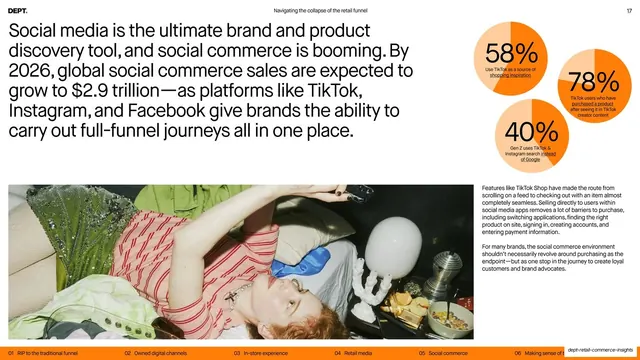
A big social-commerce statement top-left, three orange donut stats top-right, a phone-scrolling lifestyle photo bottom-left, and two body paragraphs bottom-right.
Summary
A quadrant-style data slide: a large social-commerce growth statement top-left, three orange donut stats clustered top-right, a phone-scrolling lifestyle photo bottom-left, and two supporting paragraphs bottom-right.
Visual description
The top-left carries a black statement, "Social media is the ultimate brand and product discovery tool, and social commerce is booming. By 2026, global social commerce sales are expected to grow to $2.9 trillion." The top-right clusters three orange donut charts with big percentages, "58% use TikTok as a source of shopping inspiration," "78% of TikTok users who have purchased a product," and "40% Gen Z uses TikTok & Instagram search instead of Google." The bottom-left is a candid photo of a person lying among pillows scrolling a phone; the bottom-right holds two body paragraphs about TikTok Shop removing barriers to purchase. The standard running header and orange chapter-strip footer frame the slide.
Key takeaway
Organizing a busy data slide into four clear quadrants, statement, stats, image, and detail, so a lot of content still reads in a predictable order. The trio of orange donuts repeats the deck's stat-callout language for instant consistency.
Reuse notes
A reusable layout when a slide must carry a headline claim, multiple stats, an image, and explanatory copy at once. The quadrant discipline keeps it scannable. Reuse the orange donut treatment for any single-figure stats and keep the cluster tidy so it does not crowd the statement.
From this deck: Social commerce growth statement with stat donuts and photo
View deck









More like this





Keep what you find
A free account saves references to boards and can send you a weekly email of picks based on what you save.
To see every result, go Pro.