Preview image. Unlock full-res
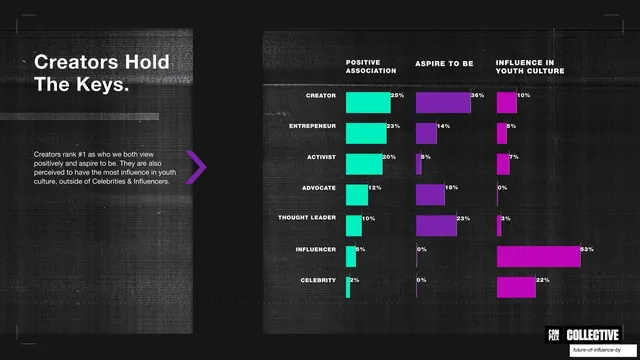
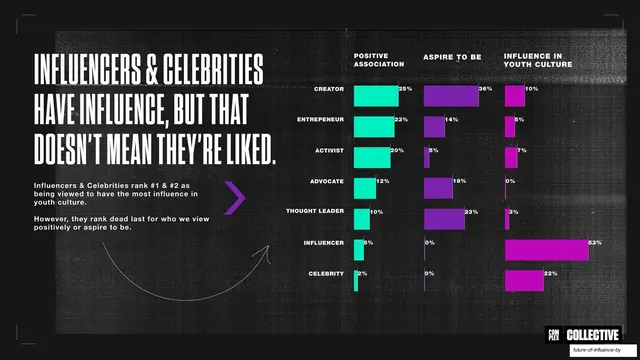
A short title-case headline beside the recurring three-column archetype bar chart, here framed inside a dark boxed panel.
Summary
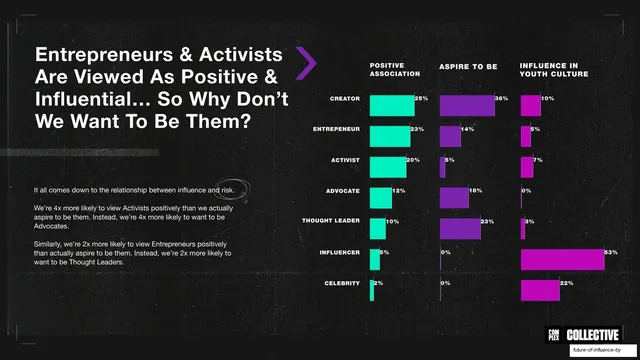
The same archetype bar chart, reused: a concise "Creators Hold The Keys" headline on the left and the three-column ranking chart inside a boxed panel on the right.
Visual description
Near-black grunge field with corner brackets. The left third has a two-line title-case headline in white sans, "Creators Hold The Keys.", a faint brushed highlight bar, a short bold sans paragraph, and a small purple chevron pointing right. The right two-thirds repeats the three-column bar chart (POSITIVE ASSOCIATION, ASPIRE TO BE, INFLUENCE IN YOUTH CULTURE) across the seven archetype rows, with teal, purple, and magenta bars and end-of-bar percentages, here enclosed in a subtly outlined dark rectangular panel. The COMPLEX | COLLECTIVE lockup is bottom-right.
Key takeaway
Re-presenting the identical chart with only a new headline and a one-line read demonstrates how one strong data visualization can carry several consecutive slides, each surfacing a different conclusion. Boxing the chart this time gives it slight variation without breaking consistency.
Reuse notes
Use when walking an audience through one dataset finding by finding. The economy of redrawing nothing and only changing the framing copy is the lesson. Keep the chart visually identical across the run so the changing headline does the storytelling.
From this deck: Creators hold the keys, archetype bar chart
View deck

More like this

Keep what you find
A free account saves references to boards and can send you a weekly email of picks based on what you save.
To see every result, go Pro.