Preview image. Unlock full-res
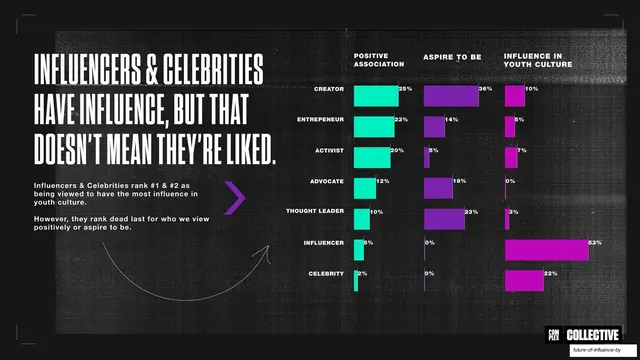
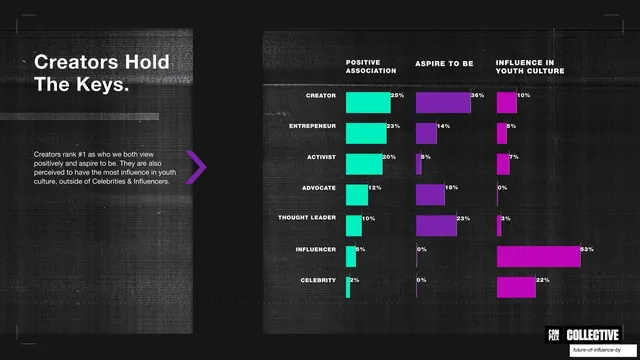
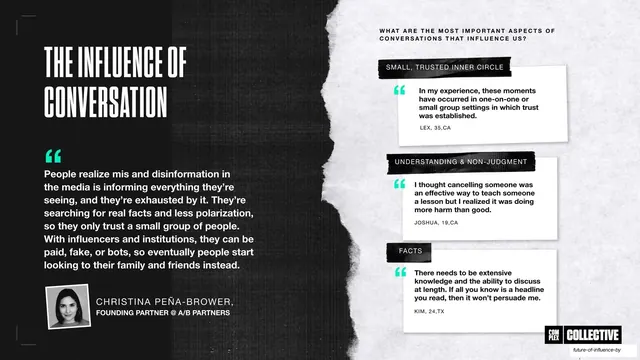
A condensed headline beside a three-column bar chart ranking creator archetypes across positive association, aspiration, and influence in teal, purple, and magenta.
Summary
The data-table workhorse: a condensed headline on the left and a three-column bar chart on the right ranking seven creator archetypes across three metrics.
Visual description
Near-black grunge field with corner brackets. The left third carries an oversized condensed all-caps headline, "INFLUENCERS & CELEBRITIES HAVE INFLUENCE, BUT THAT DOESN'T MEAN THEY'RE LIKED.", with two short bold sans paragraphs and a small purple chevron and a long hand-drawn curved arrow sweeping toward the chart. The right two-thirds is a chart with three labeled columns (POSITIVE ASSOCIATION, ASPIRE TO BE, INFLUENCE IN YOUTH CULTURE) and seven archetype rows (Creator, Entrepeneur, Activist, Advocate, Thought Leader, Influencer, Celebrity); bars are colored teal, purple, and magenta by column with the percentage labeled at each bar end. The COMPLEX | COLLECTIVE lockup is bottom-right.
Key takeaway
The three-color-by-column bar chart packs three comparisons into one readable grid, and reusing it across several slides lets the deck reveal a different insight each time without redrawing. The hand-drawn arrow links narrative copy to the relevant data.
Reuse notes
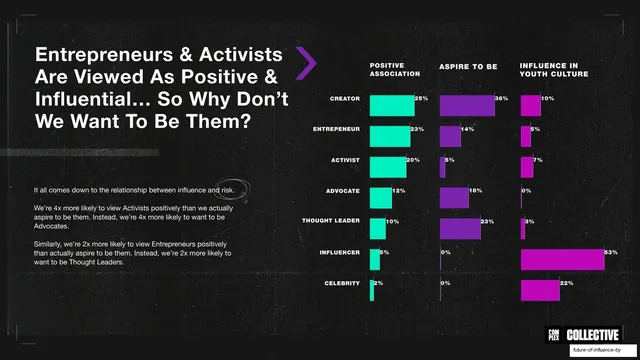
This chart is the deck's recurring analytical centerpiece, repeated on later slides with the headline and copy changed. Reuse it whenever the same dataset supports multiple narrative angles. Keep the column colors fixed so viewers learn the legend once.
From this deck: Influencers and celebrities not liked, archetype bar chart
View deck

More like this


Keep what you find
A free account saves references to boards and can send you a weekly email of picks based on what you save.
To see every result, go Pro.