Preview image. Unlock full-res
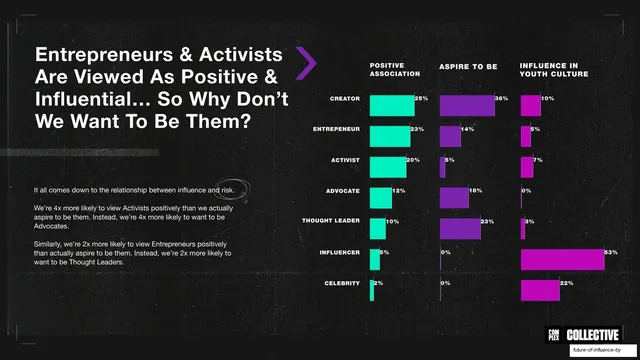
A title-case question headline with explanatory copy beside the recurring three-column archetype bar chart in teal, purple, and magenta.
Summary
A third pass on the archetype chart: a title-case question headline plus a two-paragraph explanation on the left, with the same three-column ranking chart on the right.
Visual description
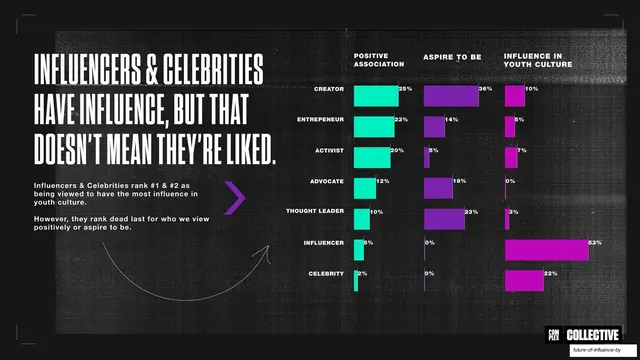
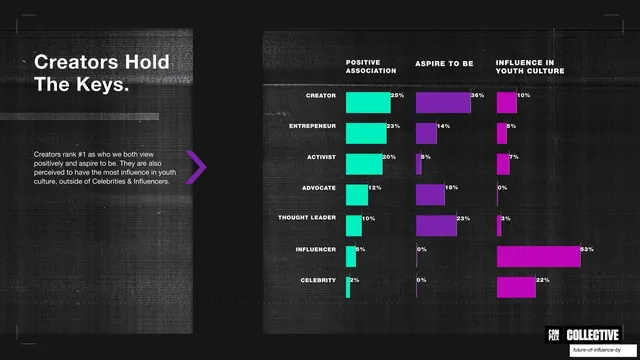
Near-black grunge field with corner brackets. The left side carries a four-line title-case question in white sans, "Entrepreneurs & Activists Are Viewed As Positive & Influential... So Why Don't We Want To Be Them?", with a purple chevron beside it, a faint brushed highlight, and two short bold sans paragraphs (one with the word "risk" circled by hand) unpacking the influence-versus-risk relationship. The right two-thirds repeats the three-column bar chart (POSITIVE ASSOCIATION, ASPIRE TO BE, INFLUENCE IN YOUTH CULTURE) across the seven archetypes, with teal, purple, and magenta bars and labeled percentages. The COMPLEX | COLLECTIVE lockup is bottom-right.
Key takeaway
A question as the headline plus longer explanatory copy turns the recurring chart into an analytical argument here, not just a data display. The hand-circled keyword draws the eye to the crux of the point.
Reuse notes
The third consecutive reuse of the chart, now with the most copy, shows the pattern's full range from quick read to deeper analysis. Reuse for the slide where the data needs the most interpretation. Keep the chart untouched so attention goes to the new reasoning.
From this deck: Entrepreneurs and activists positive, archetype bar chart
View deck

More like this

Keep what you find
A free account saves references to boards and can send you a weekly email of picks based on what you save.
To see every result, go Pro.