Preview image. Unlock full-res
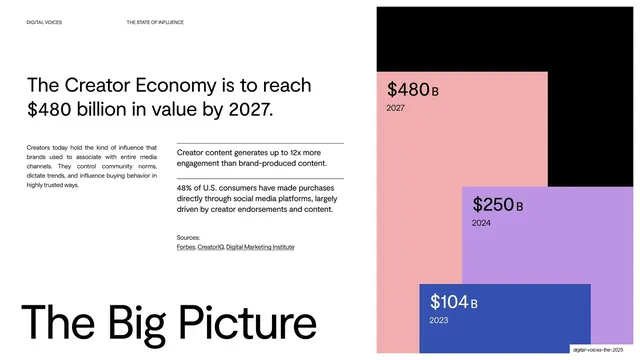
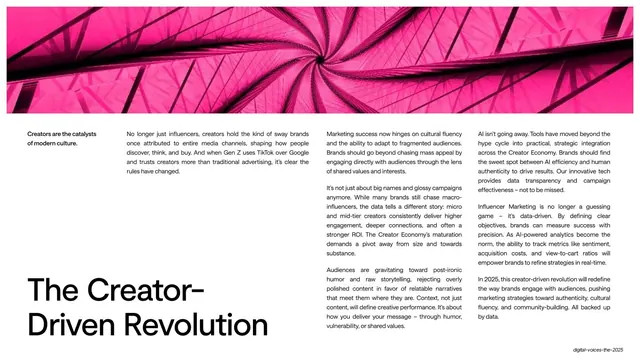
Light split slide with a headline and stat copy on the left and an overlapping pastel block chart of creator-economy value on the right.
Summary
A two-up data slide: a left text column states the $480bn projection and supporting stats, while the right half stacks three overlapping colored blocks sized to growing dollar values ($104B, $250B, $480B).
Visual description
White background, no top header. The left half leads with a large headline in black grotesque ("The Creator Economy is to reach $480 billion in value by 2027."), followed by a small justified intro paragraph, two short stat call-outs on hairline rules, and an underlined "Sources: Forbes, CreatorIQ, Digital Marketing Institute" line. An oversized lowercase "The Big Picture" sits along the bottom edge. The right half is a stepped chart of three large rectangles overlapping like a staircase: a salmon-pink block ("$480B / 2027"), a lilac block ("$250B / 2024"), and a royal-blue block ("$104B / 2023"), each labeled with a big number plus a small year, set against a black field in the top-right corner.
Key takeaway
Turning a market-size stat into a literal stacked-block staircase instead of a bar chart, with each year's value sized as an overlapping colored rectangle. The big-number-plus-small-year labels and the muted pastel-on-black palette make a single projection feel like a whole data exhibit.
Reuse notes
Good for any market-size, TAM, or growth-projection slide where you have three or four values across years. The overlapping-block treatment reads best with a short value set; more than four blocks gets muddy. Pairs with the deck's other light data slides.
From this deck: Creator economy to reach $480 billion
View deck





































More like this






Keep what you find
A free account saves references to boards and can send you a weekly email of picks based on what you save.
To see every result, go Pro.