Preview image. Unlock full-res
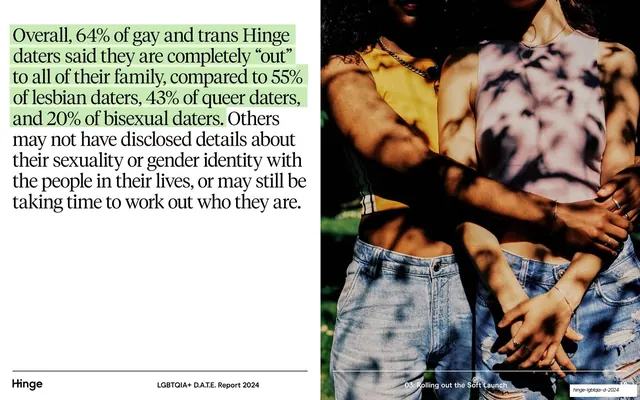
A left-aligned serif stat paragraph with a green highlight sits beside a full-bleed sunlit photo of three people embracing.
Summary
A stat-led editorial slide: a large serif paragraph on the left, its opening figures swiped with a green highlighter, set against a warm full-bleed photo of three people embracing on the right.
Visual description
The slide is split down the middle. The left half is white and holds a single large serif paragraph; its first two-and-a-half lines, carrying the 64% / 55% / 43% / 20% outness figures, are marked with a soft lime-green highlighter swipe. The running footer sits beneath on a hairline rule: "Hinge" left, "LGBTQIA+ D.A.T.E. Report 2024" center. The right half is a full-bleed, sun-dappled photograph of three people in summer clothes embracing, cropped close from shoulder to hip, with the chapter label faintly overlaid at the bottom.
Key takeaway
Using a marker-style highlight on just the data sentence inside a longer serif paragraph turns body copy into a stat callout without a chart. Pairing it with an intimate cropped photo keeps a numbers-heavy report feeling human.
Reuse notes
A flexible layout for surfacing a key statistic in narrative form: highlight the figure-bearing clause, let an editorial photo carry the other half. Reusable across any report; the green highlight is a recurring brand device here, so keep a single accent color for consistency.
From this deck: 64% out to family stat with embrace photo
View deck



More like this





Keep what you find
A free account saves references to boards and can send you a weekly email of picks based on what you save.
To see every result, go Pro.