Preview image. Unlock full-res
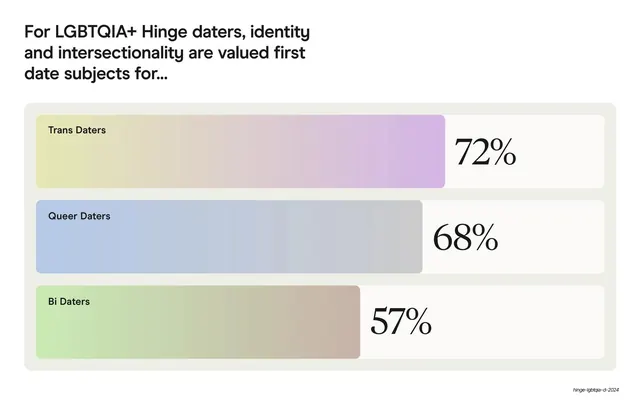
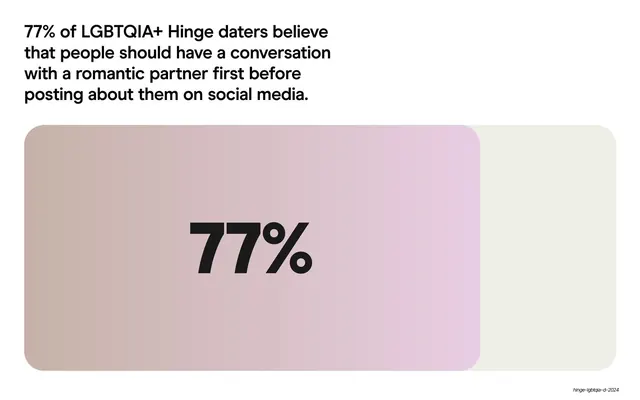
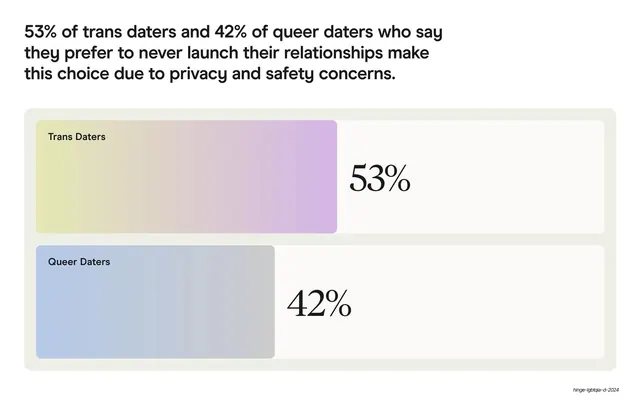
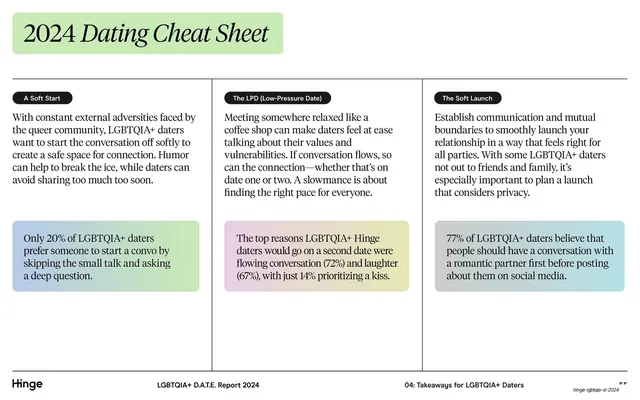
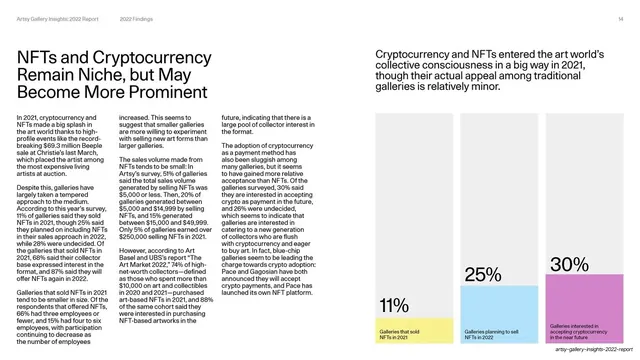
A horizontal bar chart in a rounded container, with three gradient bars (Trans, Queer, Bi daters) and oversized serif percentages.
Summary
A horizontal bar chart slide: a sans-serif headline introduces three gradient bars (Trans 72%, Queer 68%, Bi 57% daters) inside a single rounded container, with each percentage set huge in serif.
Visual description
White background. The upper-left holds a three-line bold sans headline, "For LGBTQIA+ Hinge daters, identity and intersectionality are valued first date subjects for...". Below sits a large rounded grey container holding three stacked horizontal bars. Each bar fills with a soft gradient (yellow-to-lavender, blue-to-grey, green-to-tan), carries its group label in small bold sans at the left ("Trans Daters", "Queer Daters", "Bi Daters"), and ends with an oversized serif percentage in a recessed white pocket ("72%", "68%", "57%"). The standard footer wordmark "hinge-lgbtqia-d-2024" sits small at the bottom-right.
Key takeaway
The contrast of a tidy bold sans headline with oversized serif numbers, and the trick of seating each bar's percentage in a carved-out white pocket at the end so the figure reads even over the gradient. Grouping the bars in one rounded container keeps the chart calm.
Reuse notes
Reuse for any simple ranked horizontal bar chart of two to four values. The gradient fills and serif numbers make basic data feel designed. Best when bars share a category and the values are far enough apart to read at a glance.
From this deck: Identity and intersectionality bar chart
View deck

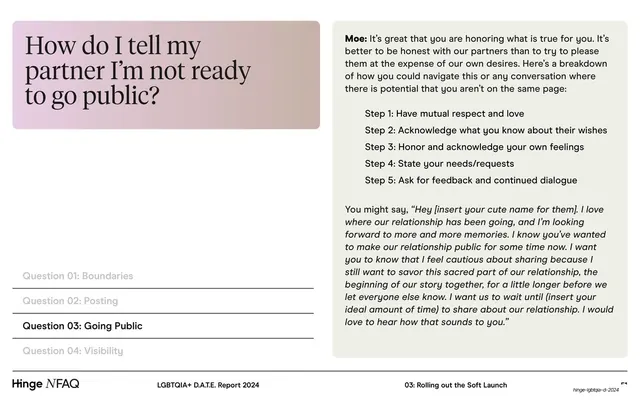
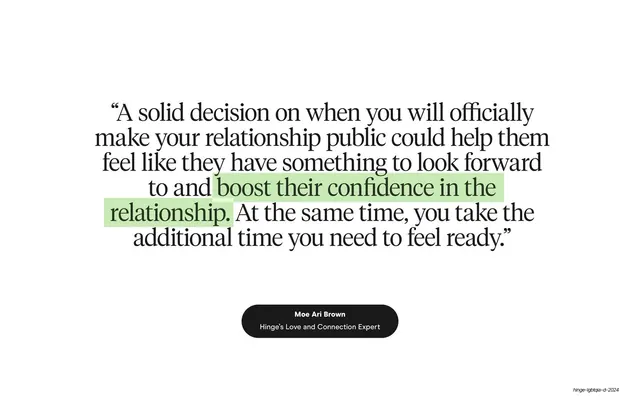
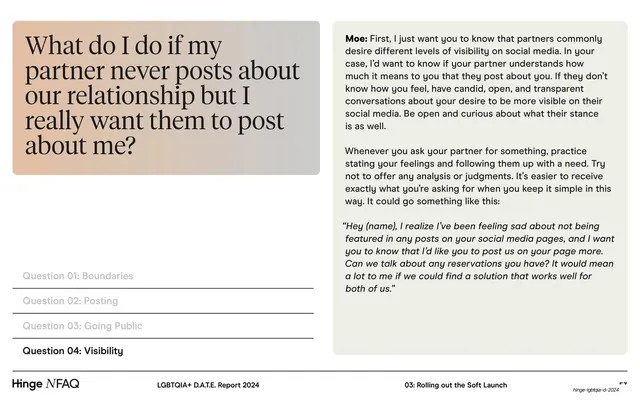
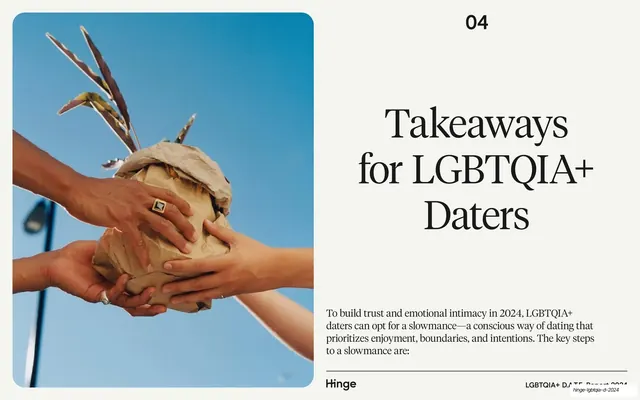
More like this




Keep what you find
A free account saves references to boards and can send you a weekly email of picks based on what you save.
To see every result, go Pro.