Preview image. Unlock full-res
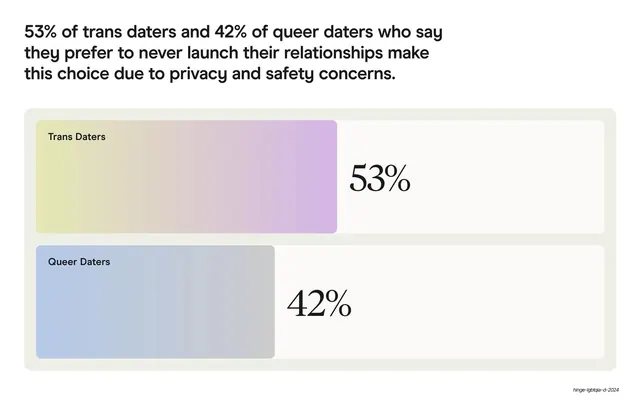
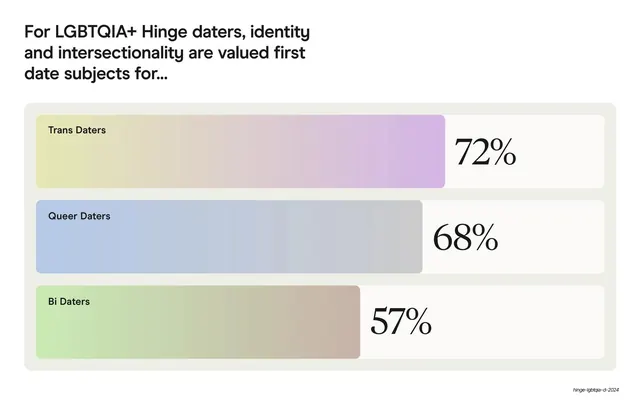
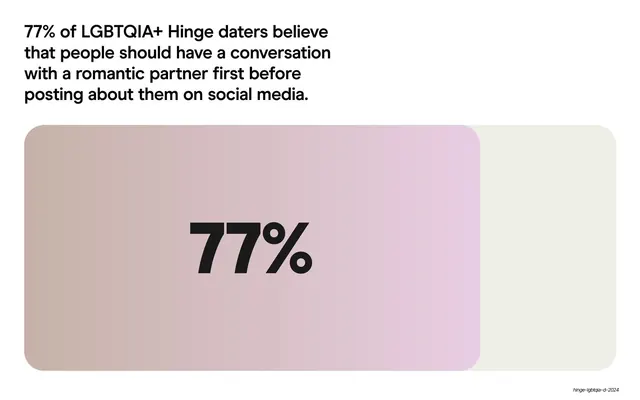
Two stacked horizontal gradient bars compare trans (53%) and queer (42%) daters inside a soft grey container, under a sans-serif headline.
Summary
A comparison slide: two horizontal gradient bars, one for trans daters at 53% and one for queer daters at 42%, nested in a soft grey rounded container under a sans-serif headline.
Visual description
A three-line sans-serif headline sits top-left stating that 53% of trans daters and 42% of queer daters who never launch cite privacy and safety. Below, a wide pale-grey rounded container holds two stacked rows. Each row is a horizontal gradient-filled rounded bar whose length encodes its value: the top "Trans Daters" bar (yellow-to-lilac gradient) extends further than the lower "Queer Daters" bar (blue-grey gradient). Each bar carries its category label at the left in small bold sans-serif and a large serif percentage (53%, 42%) just past its right end. Only the small italic slug annotation appears bottom-right.
Key takeaway
Encoding two values as horizontal bar lengths inside a single soft container makes the comparison instant, and setting the big percentage in serif against sans-serif labels ties the chart back to the deck's editorial voice.
Reuse notes
A tidy template for a two- or three-way horizontal comparison. The shared grey container groups the bars as one figure; the gradient fills keep it on-system. Reuse where bar length, not a precise axis, is the point.
From this deck: 53% / 42% never-launch horizontal bar stats
View deck














More like this






Keep what you find
A free account saves references to boards and can send you a weekly email of picks based on what you save.
To see every result, go Pro.