Preview image. Unlock full-res
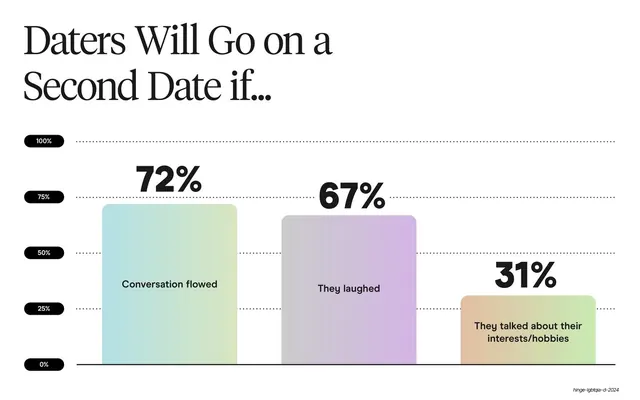
A vertical column chart with three pastel-gradient bars, a serif title, oversized sans percentages, and a black-pill percentage axis.
Summary
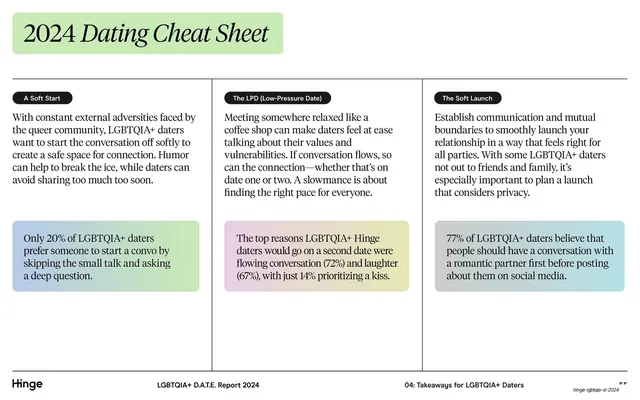
A vertical column chart: a serif title over three pastel-gradient bars (Conversation flowed 72%, They laughed 67%, interests/hobbies 31%) with oversized sans percentages and a dotted percentage scale.
Visual description
White background. The upper-left carries a two-line serif display title, "Daters Will Go on a Second Date if...". A vertical axis of black pill labels (0%, 25%, 50%, 75%, 100%) runs down the left edge, each aligned to a faint dotted horizontal gridline. Three rounded-top columns rise from a solid baseline, filled with soft gradients (blue-green, grey-lavender, tan-green); each is topped by an oversized bold sans percentage and labels its reason in small dark sans inside the bar ("Conversation flowed", "They laughed", "They talked about their interests/hobbies"). The small footer wordmark "hinge-lgbtqia-d-2024" sits at the bottom-right.
Key takeaway
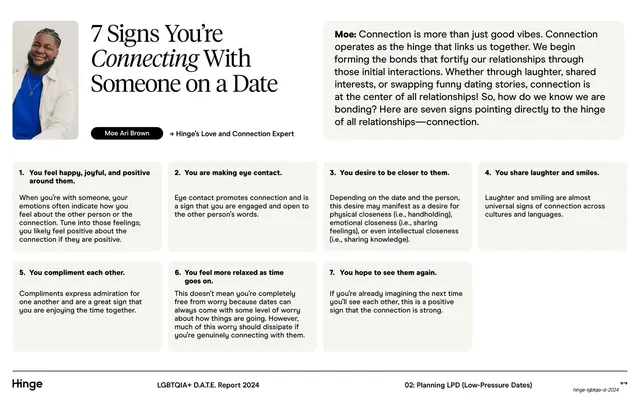
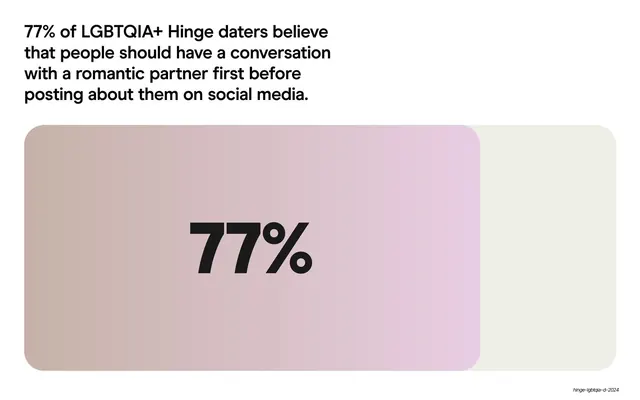
The column-chart styling: black pill axis labels on dotted gridlines, rounded-top gradient bars, and percentages set oversized in sans above each column. It makes a basic bar chart feel like part of a designed system rather than a default chart export.
Reuse notes
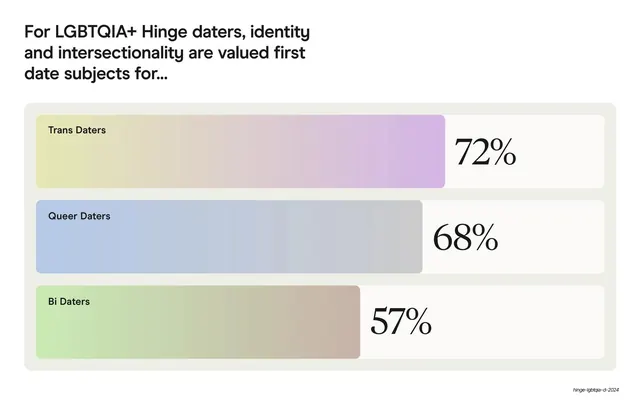
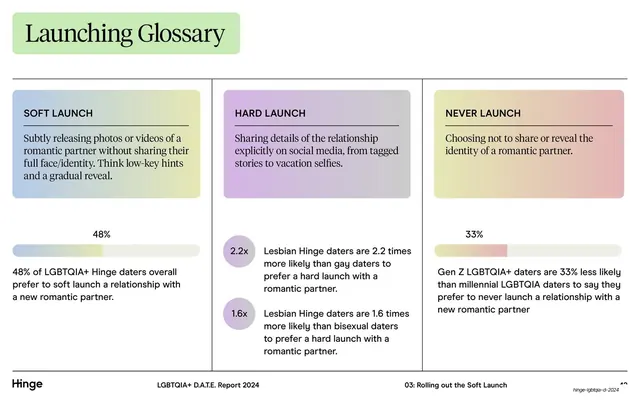
Reuse for any small vertical bar chart of three to five categories. The pill axis and gradient bars are the reusable details; keep labels inside the bars only when they fit. Matches the deck's horizontal-bar chart style, so the two read as a consistent data-viz family.
From this deck: Second date reasons column chart
View deck














More like this





Keep what you find
A free account saves references to boards and can send you a weekly email of picks based on what you save.
To see every result, go Pro.