Preview image. Unlock full-res
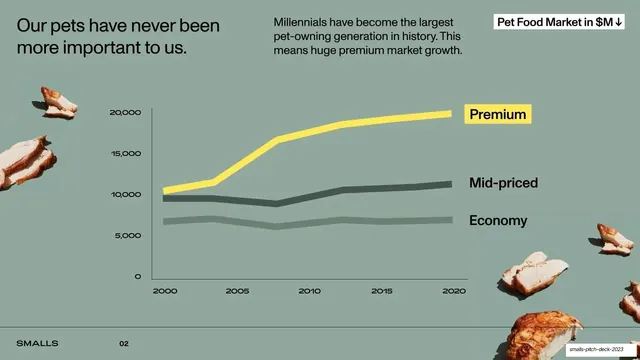
Sage-green market slide with a single yellow premium line outpacing two grey tiers, framed by cut-out roast-chicken props.
Summary
A market-trend slide: one bold yellow "Premium" line climbs well above flat grey "Mid-priced" and "Economy" lines from 2000 to 2020, on a sage-green ground dressed with cut-out roast chicken.
Visual description
Sage-green background. Top-left headline "Our pets have never been more important to us." in black sans. To its right a paragraph of supporting copy, and a white section-label box top-right reading "Pet Food Market in $M" with a down arrow. The chart fills the lower two-thirds: a y-axis to 20,000 and an x-axis from 2000 to 2020. Three lines run left to right; the topmost is a thick lemon-yellow "Premium" line that surges from ~10,000 to ~20,000, labeled with a yellow highlighter swipe behind the word "Premium". Below it sit a charcoal "Mid-priced" line and a paler grey "Economy" line, both nearly flat. Cut-out photographs of roast chicken pieces are scattered at the top-left and bottom-right corners as garnish.
Key takeaway
Coloring only the line that matters in the brand yellow and leaving every comparison line grey, so the growth story reads in a glance. The highlighter swipe behind the series label ties the legend to the brand system. Cut-out food props warm up an otherwise plain data slide.
Reuse notes
A clean template for any "our category is growing" market slide. The single-yellow-line-against-grey treatment transfers to any accent color. Keep the comparison lines genuinely muted so the hero line stays dominant. Food or product cut-outs work because the background is flat color.
From this deck: Premium pet food market growth chart
View deck






More like this






Keep what you find
A free account saves references to boards and can send you a weekly email of picks based on what you save.
To see every result, go Pro.