Preview image. Unlock full-res
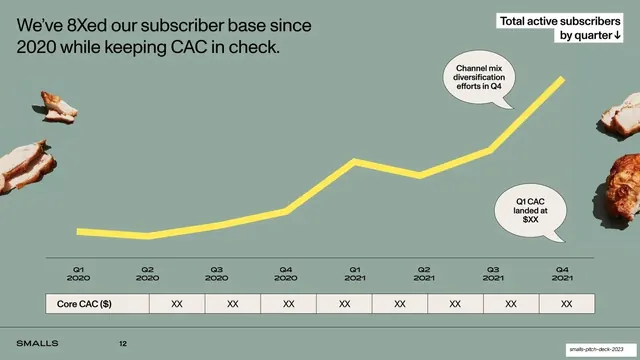
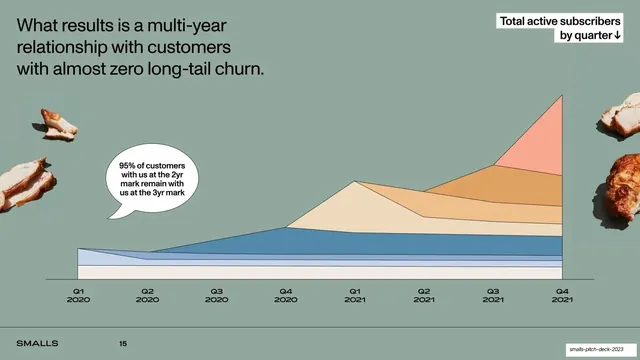
Sage-green traction slide with a rising yellow subscriber line annotated by hand-drawn speech bubbles, a Core CAC table along the bottom, and cut-out chicken props.
Summary
A traction slide: a single rising yellow subscriber line spans eight quarters, annotated with two hand-drawn speech bubbles, sitting above a "Core CAC ($)" table row, with cut-out chicken props at the edges.
Visual description
Sage-green background. Top-left headline in black: "We've 8Xed our subscriber base since 2020 while keeping CAC in check." A white box label top-right reads "Total active subscribers by quarter" with a down arrow. A thick lemon-yellow line climbs from Q1 2020 to Q4 2021 with a mid dip and a strong final rise. Two hand-drawn white speech bubbles annotate it: "Channel mix diversification efforts in Q4" near the peak and "Q1 CAC landed at $XX" lower right. Along the bottom sits a thin table: a left cell "Core CAC ($)" and eight cells reading "XX" aligned under the quarter axis labels. Cut-out roast chicken pieces sit at the top-left, bottom-left, and right edges. Footer wordmark and page number at bottom-left.
Key takeaway
Pairing a single trend line with an aligned data table beneath it lets one slide show both the shape of growth and the quarter-by-quarter unit-economics numbers. The hand-drawn speech bubbles add a casual, human voice to the annotations that suits a friendly consumer brand. Keeping the line one yellow series means no legend is needed.
Reuse notes
A reusable traction template when you want a growth curve plus a supporting metric row in the same frame. Speech-bubble callouts are charming but use them sparingly so they do not clutter the line. The CAC row is redacted to XX in the public version. Cut-out props work because the background is flat color. Note the printed page number lags the deck order.
From this deck: 8x subscriber growth line chart with CAC table
View deck









More like this





Keep what you find
A free account saves references to boards and can send you a weekly email of picks based on what you save.
To see every result, go Pro.