Preview image. Unlock full-res
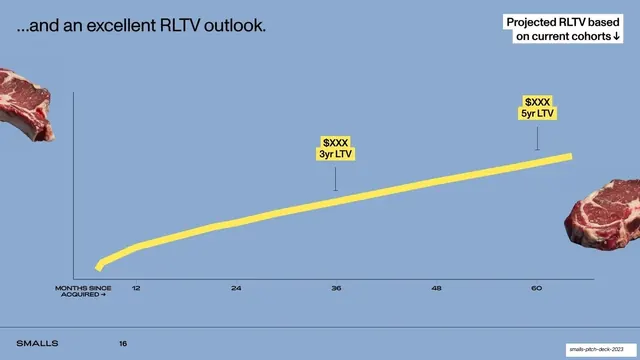
Periwinkle slide with a single rising yellow RLTV line over 60 months, tagged with highlighted 3yr and 5yr LTV markers and framed by cut-out raw steak.
Summary
An LTV slide: one rising yellow line plots revenue lifetime value against months since acquisition out to 60 months, with highlighted "$XXX 3yr LTV" and "$XXX 5yr LTV" markers and cut-out raw steak at the corners.
Visual description
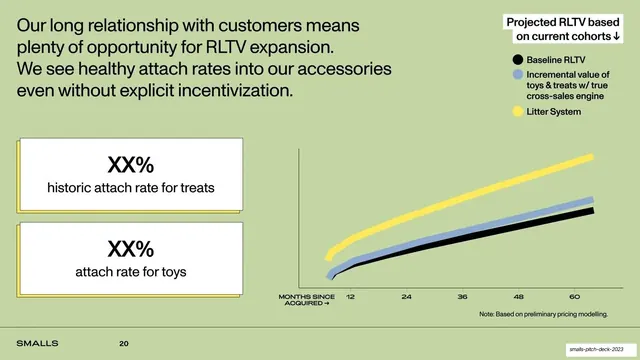
Soft periwinkle background. Top-left headline in black: "...and an excellent RLTV outlook." A white box label top-right reads "Projected RLTV based on current cohorts" with a down arrow. A single thick lemon-yellow line rises steadily from the origin along an x-axis labeled "MONTHS SINCE ACQUIRED" with ticks at 12, 24, 36, 48, 60. Two yellow-highlighted labels with thin drop lines mark points on the curve: "$XXX 3yr LTV" near month 36 and "$XXX 5yr LTV" near month 60. Cut-out raw bone-in steaks sit at the top-left and bottom-right. Footer wordmark and page number at bottom-left.
Key takeaway
Continuing the deck's discipline of one yellow line per chart, here for LTV, so the whole performance section shares a visual grammar. Highlighted milestone labels (3yr, 5yr) tied to drop lines make the headline figures legible without cluttering the curve. The leftover whitespace around a gently rising line reads as calm confidence.
Reuse notes
A reusable LTV or cumulative-value template. The single-yellow-line treatment matches the other charts in this deck, reinforcing consistency. Public version redacts the dollar figures to $XXX. Use one or two milestone markers, not a label on every tick. The steak cut-outs are a brand motif; swap for your own props. Pairs naturally right after a retention slide.
From this deck: RLTV outlook line chart by months since acquired
View deck












More like this









Keep what you find
A free account saves references to boards and can send you a weekly email of picks based on what you save.
To see every result, go Pro.