Preview image. Unlock full-res
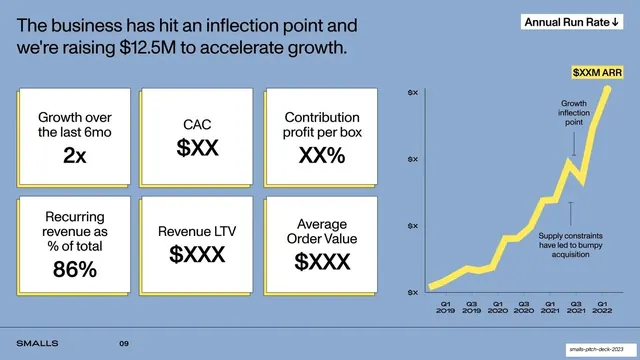
Periwinkle traction slide pairing a 2x3 grid of white KPI cards on yellow shadows with a yellow annotated ARR line ending in a $XXM peak.
Summary
A traction-and-ask slide: a 2x3 grid of white KPI cards on the left states the headline metrics while a yellow annotated line chart on the right climbs to a "$XXM ARR" peak, marking the growth inflection point.
Visual description
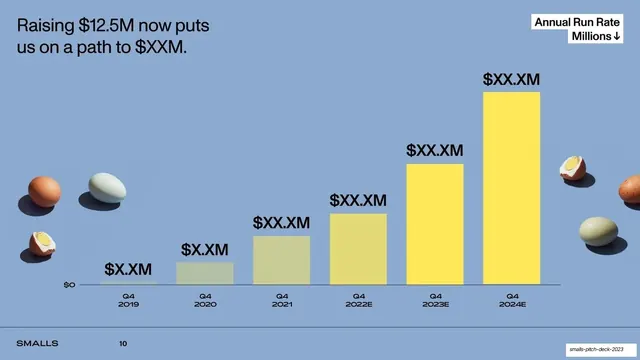
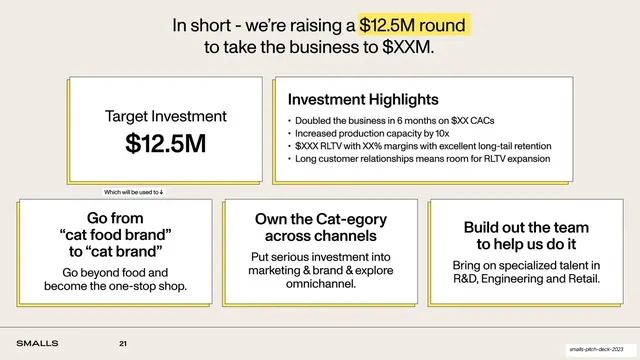
Soft periwinkle background. Top-left headline: "The business has hit an inflection point and we're raising $12.5M to accelerate growth." Beneath it, a two-row, three-column grid of white cards, each on a hard yellow drop-shadow, holding a label and an oversized black figure: "Growth over the last 6mo 2x", "CAC $XX", "Contribution profit per box XX%", "Recurring revenue as % of total 86%", "Revenue LTV $XXX", "Average Order Value $XXX". On the right, a white box label "Annual Run Rate" with a down arrow tops a thick lemon-yellow line chart rising from Q1 2019 to Q1 2022; the peak is tagged "$XXM ARR" on a yellow swipe, with thin black annotations "Growth inflection point" and "Supply constraints have led to bumpy acquisition" pointing at the curve. Footer at bottom-left.
Key takeaway
Combining a KPI card grid with a single trend line on one slide gives both the snapshot numbers and the trajectory without two slides. The oversized figures on white cards (on the recurring yellow shadow) make the metrics the loudest thing. Keeping the line a single brand yellow with sparse black annotations keeps a busy slide readable.
Reuse notes
A dense but effective traction template when you want headline KPIs and the growth curve side by side. The 2x3 card grid scales to your real numbers; the public version is redacted to $XX placeholders. Limit chart annotations to one or two so they do not fight the line. Strong as the pivot slide that sets up the ask.
From this deck: Inflection point metrics and ARR chart
View deck






More like this


Keep what you find
A free account saves references to boards and can send you a weekly email of picks based on what you save.
To see every result, go Pro.