Preview image. Unlock full-res
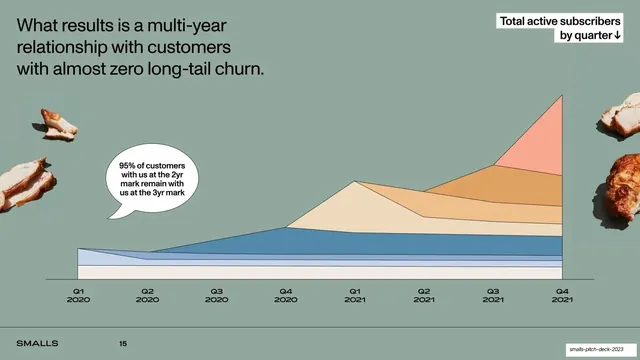
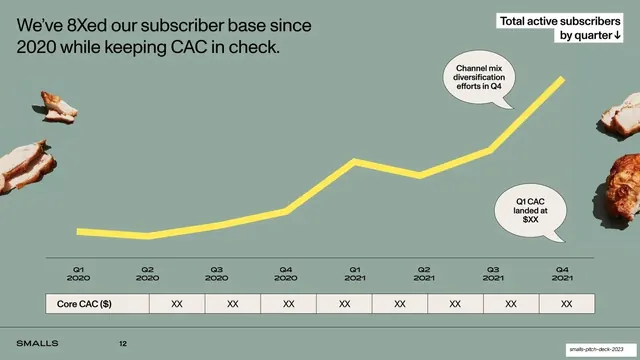
Sage-green retention slide with a stacked area chart of active subscribers by quarter and a speech bubble citing 95% retention from the two- to three-year mark, framed by chicken props.
Summary
A retention slide: a stacked area chart of active subscribers by quarter (Q1 2020 to Q4 2021) layers in successive cohort bands, with a speech bubble noting 95% of two-year customers remain at the three-year mark.
Visual description
Sage-green background. Top-left headline in black: "What results is a multi-year relationship with customers with almost zero long-tail churn." A white box label top-right reads "Total active subscribers by quarter" with a down arrow. A stacked area chart fills the lower portion: a flat pale base layer, a blue cohort band, and warmer cream, tan, and coral bands that build up and grow toward the right edge, showing cohorts retained and stacked over eight quarters. A white speech bubble at left reads "95% of customers with us at the 2yr mark remain with us at the 3yr mark". Cut-out roast chicken pieces sit at the top-left, bottom-left, and right edges. Footer wordmark and page number at bottom-left.
Key takeaway
A stacked area chart of retained cohorts visually proves low churn: older bands persist as new ones pile on top, so the growing total reads as "nobody leaves." Pulling the single retention stat into a speech bubble gives the eye one number to anchor on. The consistent yellow-deck palette is relaxed here into multi-band pastels while staying soft and on-brand.
Reuse notes
A reusable retention or cohort-stacking template for subscription businesses. Stacked-area cohort charts are powerful but need clean underlying data to avoid muddiness; cap the number of bands. Keep one callout bubble for the headline retention figure. Food cut-outs work against the flat ground. Note the printed page number lags the deck order.
From this deck: Multi-year retention stacked area chart
View deck








More like this



Keep what you find
A free account saves references to boards and can send you a weekly email of picks based on what you save.
To see every result, go Pro.