Preview image. Unlock full-res
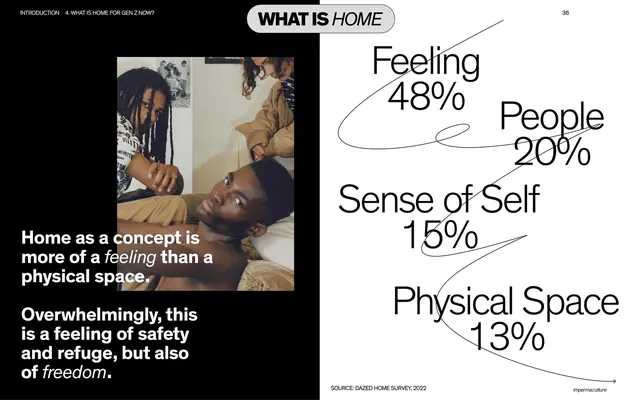
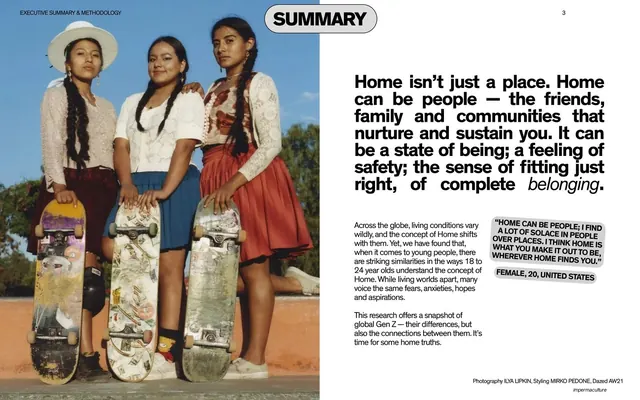
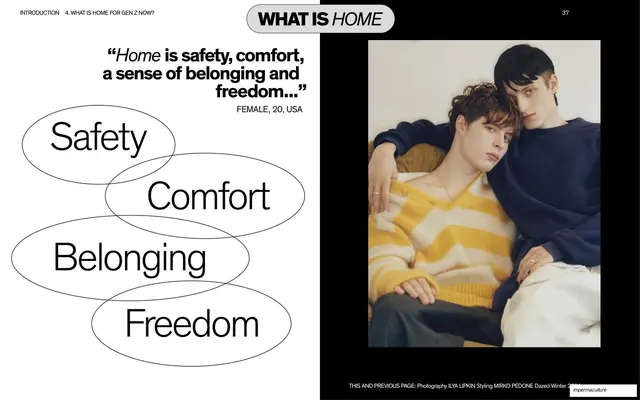
Black two-column spread with a fashion photo and body copy left, and four survey percentages set in large type strung along a hand-drawn looping line on the right.
Summary
A dark data spread answering "what is home": a portrait photo and short bold statements on the left, and four survey figures (Feeling 48%, People 20%, Sense of Self 15%, Physical Space 13%) set large and threaded along a single curving hand-drawn line on the right.
Visual description
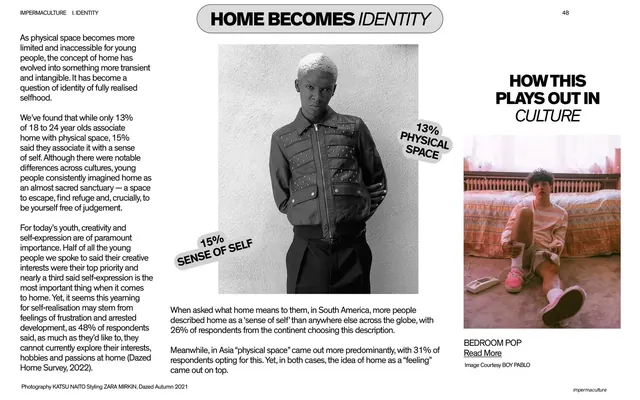
Near-black full background. Top-left utility header and a rounded white pill badge reading "WHAT IS HOME" (with "HOME" italicized) sit at the top. Left third holds a vertical fashion photograph of three young people in warm tones. Below it, white text: "Home as a concept is more of a feeling than a physical space." and "Overwhelmingly, this is a feeling of safety and refuge, but also of freedom.", with "feeling" and "freedom" italicized. The right two-thirds carries four large white labels with percentages, each placed at a different point along one continuous looping hand-drawn line: Feeling 48%, People 20%, Sense of Self 15%, Physical Space 13%. A small source note, "SOURCE: DAZED HOME SURVEY, 2022", sits bottom-center; the impermaculture badge is bottom-right.
Key takeaway
Turning a dry ranked list of survey results into a piece of typographic illustration by stringing the figures along a single hand-drawn line instead of a bar chart. The rounded pill section label is a clean, repeatable wayfinding device.
Reuse notes
Great for report spreads that need to present a few headline statistics with personality rather than a standard chart. Best with only a handful of data points; the loose line layout would get unreadable with many. Pairs the data with a human photo to keep an emotional topic grounded.
From this deck: What is home, feeling vs physical space data spread
View deck































More like this







Keep what you find
A free account saves references to boards and can send you a weekly email of picks based on what you save.
To see every result, go Pro.