Preview image. Unlock full-res
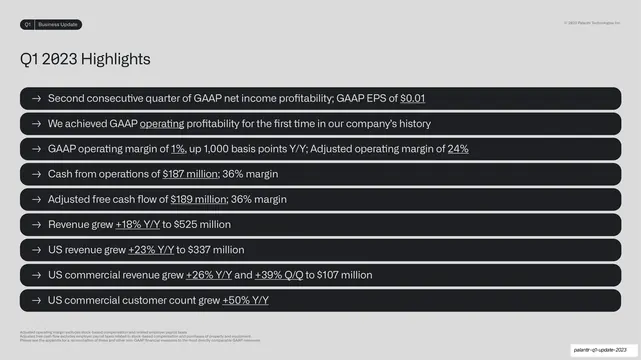
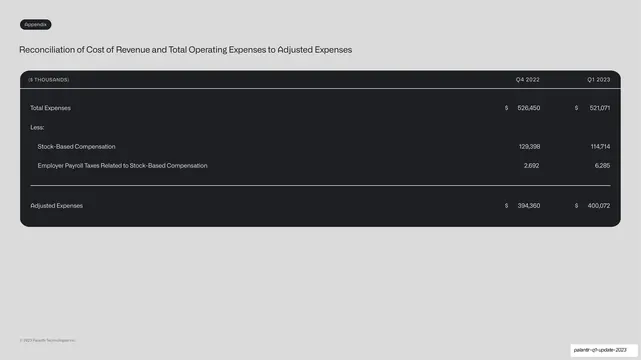
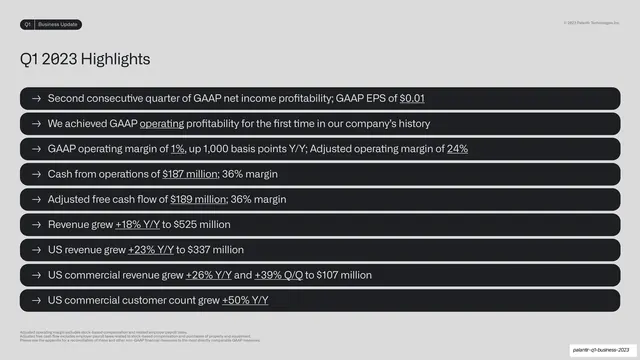
A highlights slide listing ten key Q1 results as full-width dark pill rows on grey, each led by an arrow and with metrics underlined.
Summary
A scannable highlights list: ten Q1 results, each in its own full-width dark pill row with the headline metric underlined.
Visual description
Light-grey background. A small "Q1 | Business Update" pill tab sits top-left, copyright top-right. "Q1 2023 Highlights" is set large in dark grotesque below. The body is a stack of ten full-width near-black rounded pill rows, each beginning with a thin right-arrow glyph, then a single result in light type with the key figure underlined ("GAAP EPS of $0.01", "Revenue grew +18% Y/Y to $525 million"). A few lines of small footnote text sit at the bottom-left.
Key takeaway
Turning a bullet list into a rhythm of identical full-width dark pills, each with one fact and one underlined number, so a busy summary stays scannable. The repeated arrow glyph gives the eye a consistent entry point per row.
Reuse notes
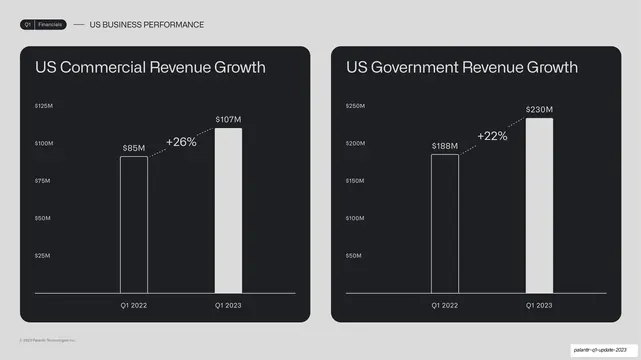
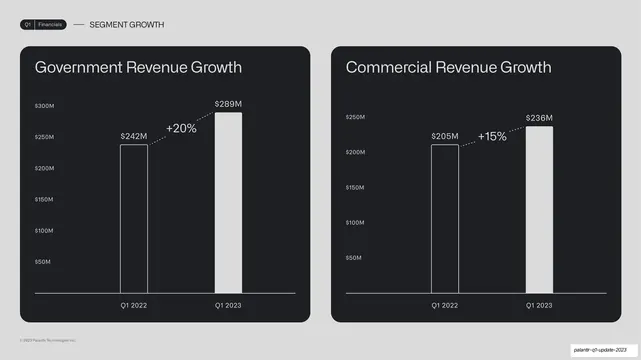
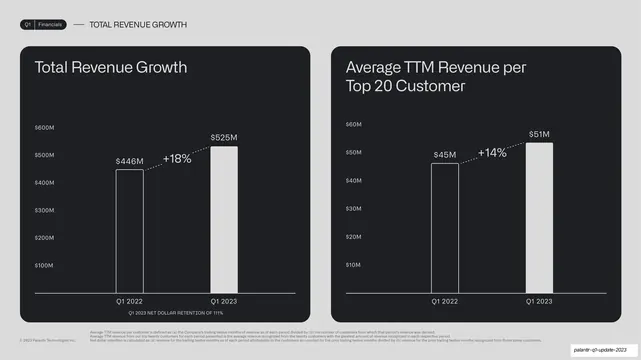
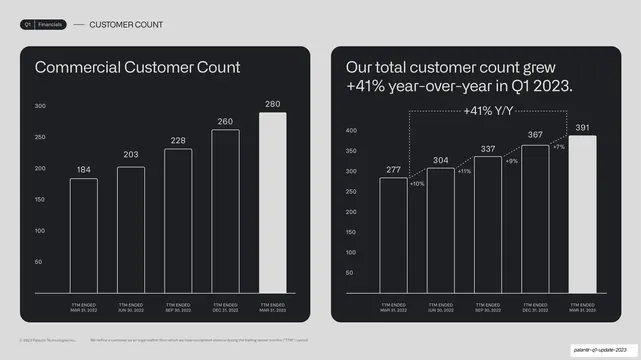
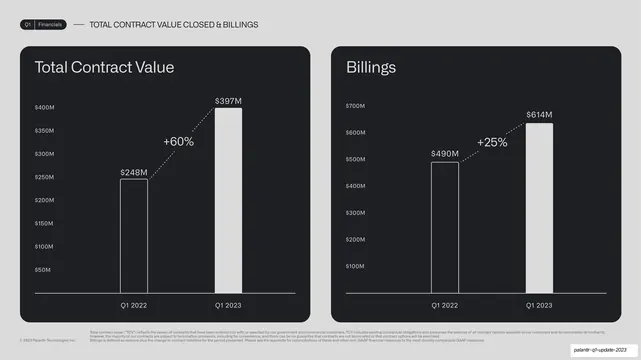
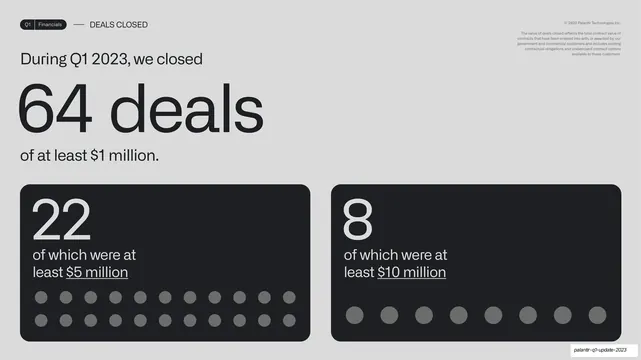
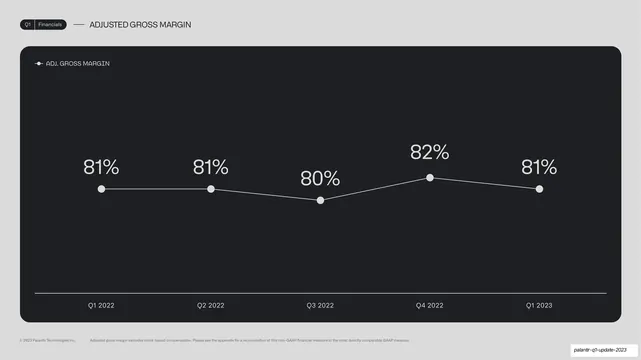
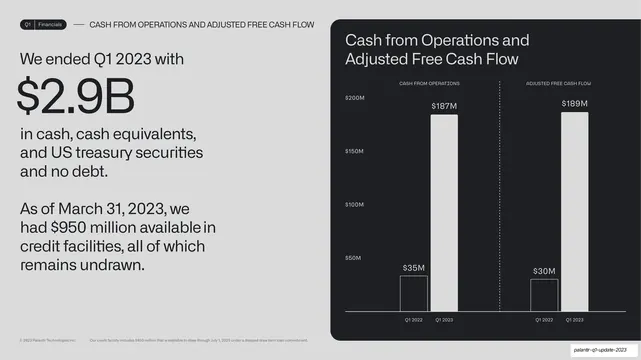
A clean pattern for an executive-summary or highlights slide where every line is a metric. The underline-the-number move makes the takeaways pop without color. Best capped at about ten rows before the pills get too thin; pairs with the chart slides that follow by previewing their figures.
From this deck: Q1 2023 Highlights list
View deck




More like this



Keep what you find
A free account saves references to boards and can send you a weekly email of picks based on what you save.
To see every result, go Pro.