Preview image. Unlock full-res
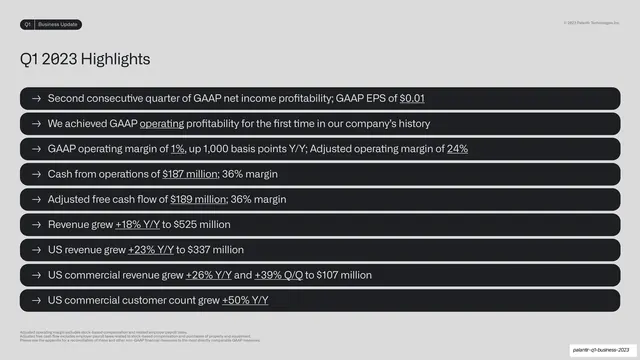
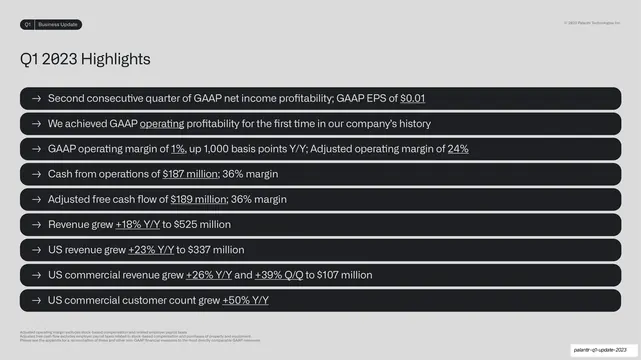
A nine-row highlights list on a light field, each metric in its own full-width near-black pill with a leading arrow and underlined key figures.
Summary
The quarter at a glance: nine highlight statements, each in its own full-width near-black pill with a leading arrow and key numbers underlined.
Visual description
A light grey slide. The running header shows the "Q1 | Business Update" pill top-left and copyright top-right. A medium "Q1 2023 Highlights" heading sits beneath. Below it, nine stacked rounded near-black bars run the full width, each holding one light-grey sentence preceded by a small right-arrow glyph. The most important figures inside each row are underlined ("$0.01", "+18% Y/Y", "+50% Y/Y"). Small grey footnote lines about adjusted measures sit at the bottom-left.
Key takeaway
Turning a metrics summary into a stack of identical full-width pills, one statement per row, so a dense list scans like a checklist. Underlining only the key number inside each sentence guides the eye without bolding everything.
Reuse notes
An efficient pattern for an executive-summary or highlights slide in any report or investor deck. The pill rows scale to roughly eight to ten items before they crowd; beyond that, split across two slides. Works on either light or dark backgrounds by inverting the pill fill.
From this deck: Q1 2023 Highlights bullet list
View deck














More like this






Keep what you find
A free account saves references to boards and can send you a weekly email of picks based on what you save.
To see every result, go Pro.