Preview image. Unlock full-res
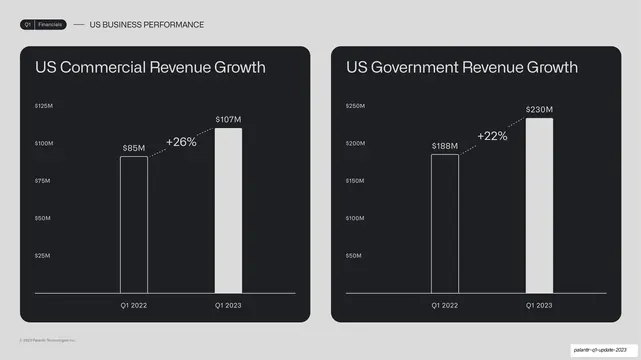
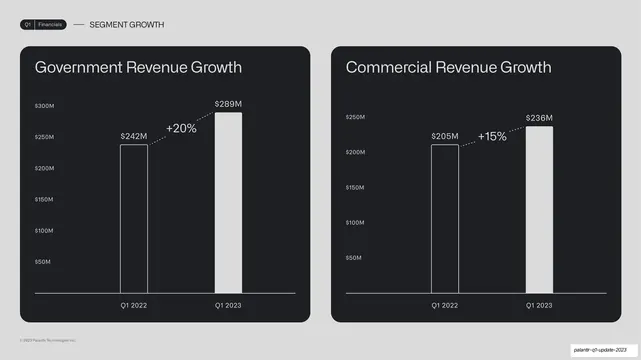
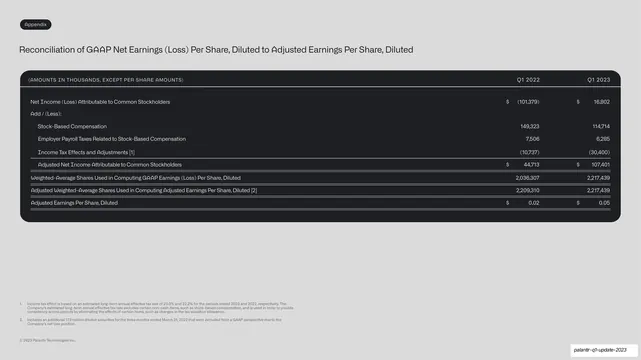
Two side-by-side dark cards comparing US commercial (+26%) and US government (+22%) revenue, each a two-bar year-over-year chart.
Summary
A two-up segment comparison: two equal dark cards side by side, US Commercial Revenue Growth (+26%) and US Government Revenue Growth (+22%), each a two-bar year-over-year chart.
Visual description
Light-grey background, "Q1 | Financials" pill tab and "US BUSINESS PERFORMANCE" label up top. Two equally sized near-black rounded cards fill the slide side by side. Each is titled at top-left ("US Commercial Revenue Growth", "US Government Revenue Growth") and holds two vertical bars, an outlined Q1 2022 and a filled white Q1 2023, with a dotted connector labeled with the growth percentage (+26% at left, +22% at right) and each bar value called out ($85M to $107M; $188M to $230M).
Key takeaway
The two-equal-cards layout for comparing two segments on one slide, each rendered in the identical chart style so the eye compares them directly. No left-hand takeaway here; the two titled charts speak for themselves.
Reuse notes
Reusable whenever two parallel metrics belong together (two segments, two regions, two products). Matching the chart treatment exactly across both cards is what makes the comparison fair and fast. The deck repeats this two-up card pattern several times in the section.
From this deck: US commercial vs government revenue two-up
View deck






More like this






Keep what you find
A free account saves references to boards and can send you a weekly email of picks based on what you save.
To see every result, go Pro.