Preview image. Unlock full-res
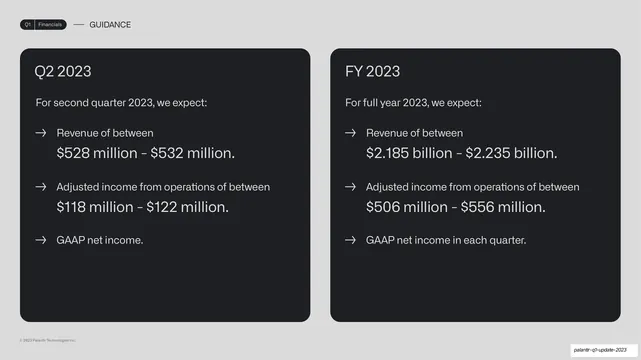
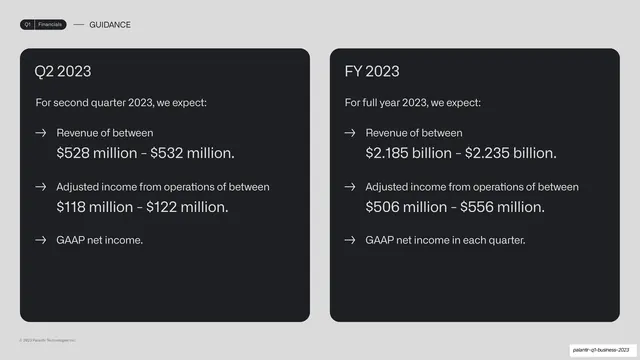
Two side-by-side dark cards giving forward guidance, Q2 2023 and FY 2023, each an arrow-led list of expected revenue, adjusted income, and GAAP profitability.
Summary
A forward-guidance slide: two equal dark cards, Q2 2023 and FY 2023, each an arrow-led list of expected revenue, adjusted income, and GAAP profitability.
Visual description
Light-grey background, "Q1 | Financials" pill tab and "GUIDANCE" label up top. Two equally sized near-black rounded cards sit side by side, headed "Q2 2023" and "FY 2023" in light grotesque. Each opens with "For ... we expect:" and lists three arrow-led items, where the metric label is on one line and the figure is set larger beneath it ("Revenue of between / $528 million - $532 million", "Adjusted income from operations of between / $118 million - $122 million", "GAAP net income"). No charts; pure typographic lists.
Key takeaway
The two-card outlook layout that places the near-term and full-year guidance side by side using the same arrow-led list, so the reader compares horizons at a glance. Setting each figure larger on its own line under a quiet label gives the numbers weight without a chart.
Reuse notes
A clean guidance or goals slide for any forward-looking section. The matched two-card structure works for any near-term vs long-term pairing. Keep each card to three or four items so the figures stay prominent.
From this deck: Q2 and FY 2023 guidance two-up
View deck




More like this


Keep what you find
A free account saves references to boards and can send you a weekly email of picks based on what you save.
To see every result, go Pro.