Preview image. Unlock full-res
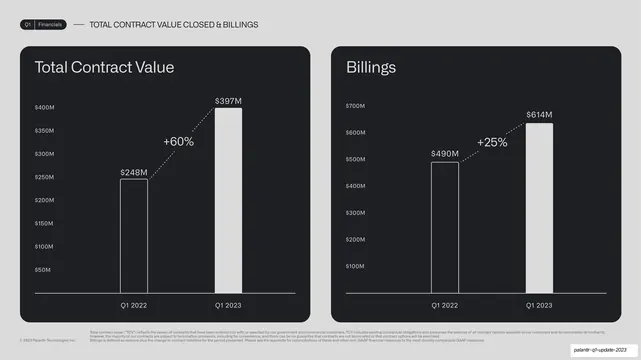
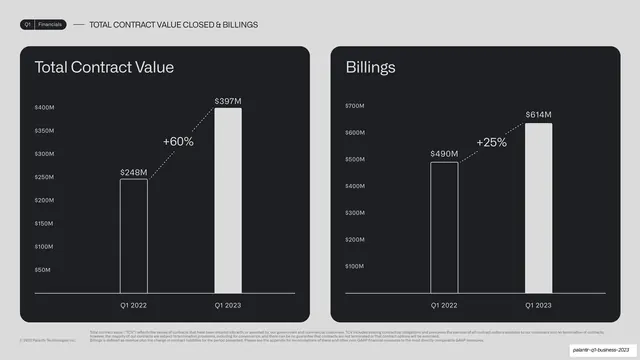
Two side-by-side dark cards, Total Contract Value (+60%) and Billings (+25%), each a two-bar year-over-year chart with a steep dotted growth connector.
Summary
A two-up data slide: Total Contract Value (+60%, to $397M) and Billings (+25%, to $614M), each a two-bar year-over-year chart in a dark card.
Visual description
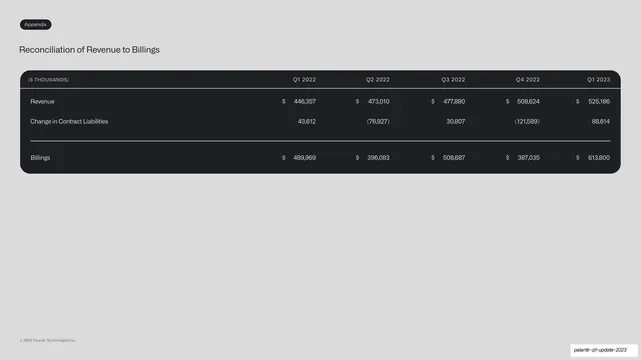
Light-grey background, "Q1 | Financials" pill tab and "TOTAL CONTRACT VALUE CLOSED & BILLINGS" label up top. Two equal near-black rounded cards. The left "Total Contract Value" shows $248M rising to $397M with a steep dotted "+60%" connector; the right "Billings" shows $490M rising to $614M with a "+25%" connector. Outlined prior-year bar, filled white current-year bar in both. Several lines of small definitional footnotes (defining TCV and billings) run across the bottom.
Key takeaway
The same two-bar comparison chassis, now with a markedly steep connector to dramatize a large jump (+60%). The connector's angle itself communicates magnitude before the reader even reads the percentage.
Reuse notes
Reuse for any pair of pipeline or bookings metrics. Letting the connector slope reflect the size of the gain adds a free layer of meaning. As with the other comparison slides, keep the bar and label treatment identical to neighbors so the section reads as one system.
From this deck: Total contract value and billings two-up
View deck





More like this




Keep what you find
A free account saves references to boards and can send you a weekly email of picks based on what you save.
To see every result, go Pro.