Preview image. Unlock full-res
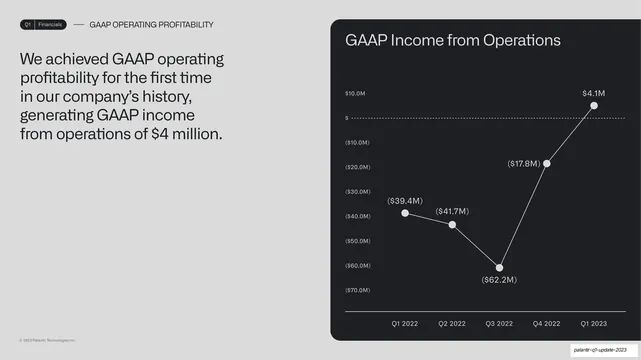
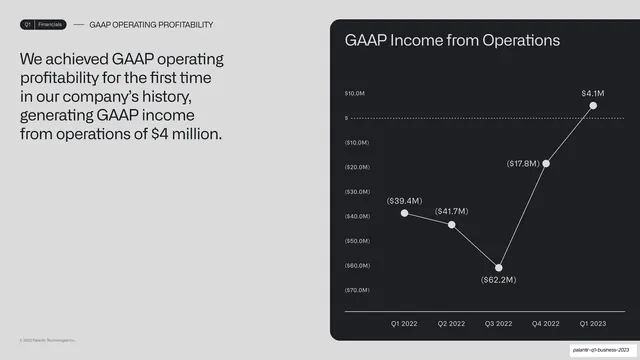
A headline-left, chart-right slide with a GAAP income-from-operations line chart in a dark card rising from a deep loss to a small profit.
Summary
A financial chart slide: takeaway at left, a GAAP income-from-operations line chart at right rising from a deep loss across five quarters to a small positive figure.
Visual description
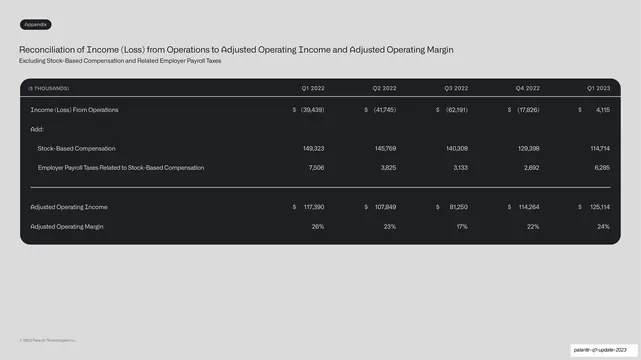
Light-grey background, "Q1 | Financials" pill tab and "GAAP OPERATING PROFITABILITY" label up top. The left column carries the statement in dark grotesque: "We achieved GAAP operating profitability for the first time in our company's history, generating GAAP income from operations of $4 million." At right, a near-black rounded card titled "GAAP Income from Operations" holds a white line chart climbing from about ($62.2M) at Q3 2022 up through a dotted zero baseline to $4.1M at Q1 2023, every point labeled.
Key takeaway
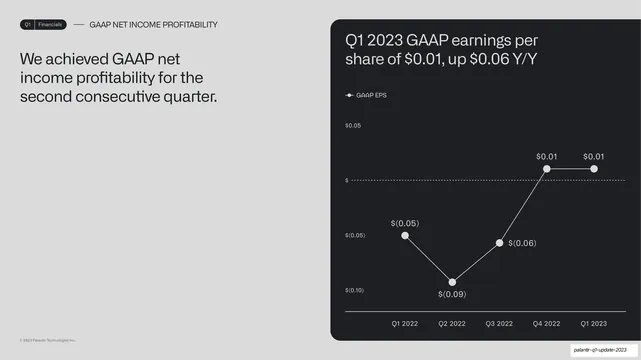
The same headline-left / chart-in-card template as the EPS slide, reused without variation, which is the point: a metrics section reads cleanly when every slide shares one layout and only the takeaway and the data change.
Reuse notes
Reuse alongside the other line-chart slides for a consistent earnings narrative. The dotted zero baseline again does the "turned profitable" work. Keep the left takeaway to two or three short sentences so it balances the card.
From this deck: GAAP income from operations line chart
View deck





More like this




Keep what you find
A free account saves references to boards and can send you a weekly email of picks based on what you save.
To see every result, go Pro.