Preview image. Unlock full-res
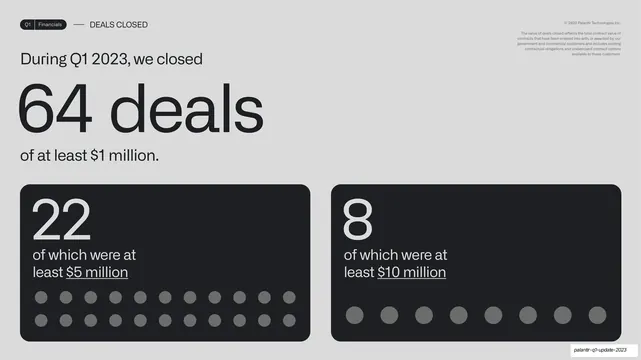
A slide leading with an oversized "64 deals" then two dark cards counting deals over $5M (22) and over $10M (8) with literal rows of dot glyphs.
Summary
A deals-closed slide: an oversized "64 deals" headline, then two dark cards counting the larger deals (22 over $5M, 8 over $10M) with literal rows of dots.
Visual description
Light-grey background, "Q1 | Financials" pill tab and "DEALS CLOSED" label up top, with a small right-aligned definitional note at top-right. The upper left reads "During Q1 2023, we closed" then "64 deals" set very large in dark grotesque, then "of at least $1 million." Below sit two near-black rounded cards: the left shows a big "22" over "of which were at least $5 million" above two rows of grey dots (twenty-two of them); the right shows "8" over "of which were at least $10 million" above a single row of eight larger grey dots. The dollar thresholds are underlined.
Key takeaway
The pictograph move: representing a count as the literal number of dots, so "22" and "8" are felt as quantity, not just read. Pairing a hero number on the grey field with dot-count cards below makes a dry deal stat tangible.
Reuse notes
Reuse for count metrics where you want the magnitude to land viscerally, deals, logos, hires, milestones. The dot count works best for small-to-medium totals; very large counts overflow. Sizing the dots up for the smaller "8" subtly signals those deals are bigger.
From this deck: Deals closed big number with dot counts
View deck








More like this







Keep what you find
A free account saves references to boards and can send you a weekly email of picks based on what you save.
To see every result, go Pro.