Preview image. Unlock full-res
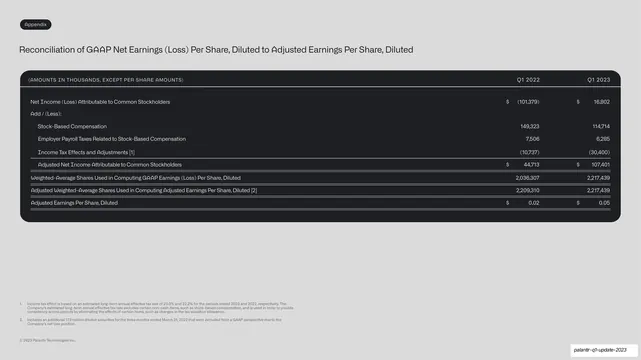
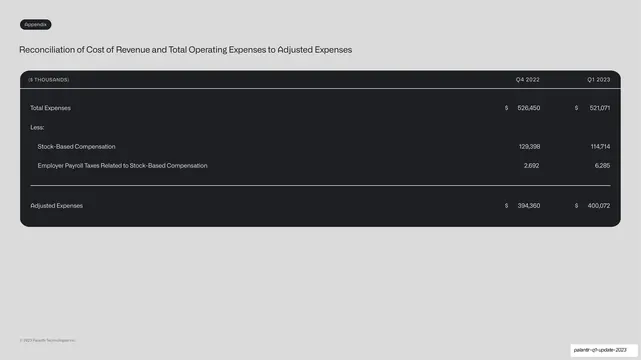
An appendix reconciliation table in a dark panel walking GAAP net earnings per share to adjusted diluted EPS, with multiple ruled subtotal rows and numbered footnotes.
Summary
An appendix reconciliation table walking from GAAP net earnings (loss) per diluted share to adjusted diluted EPS, with several ruled subtotal rows and numbered footnotes.
Visual description
Light-grey background, "Appendix" pill tab top-left, with the long table title above. A wide near-black rounded panel holds a two-column table (Q1 2022, Q1 2023) with a monospace "(AMOUNTS IN THOUSANDS, EXCEPT PER SHARE AMOUNTS)" header. The table is denser than the others: an "Add / (Less):" block with several indented adjustment rows, then full-width hairline rules separating each computed subtotal, Adjusted Net Income, two weighted-average share-count rows, and a final Adjusted Earnings Per Share line ($0.02, $0.05). Two numbered footnotes sit well below the panel.
Key takeaway
Handling a more complex reconciliation by ruling off each computed subtotal with a full-width hairline, so a reader can trace several intermediate results, not just the final number. Numbered footnotes keep the dense methodology out of the table body.
Reuse notes
Reuse for the most involved reconciliations (per-share metrics, multi-step adjustments). Full-width separators between subtotals are worth it when there is more than one result to read. Pull methodology into numbered footnotes rather than crowding the rows.
From this deck: Adjusted EPS reconciliation table
View deck







More like this





Keep what you find
A free account saves references to boards and can send you a weekly email of picks based on what you save.
To see every result, go Pro.