Preview image. Unlock full-res
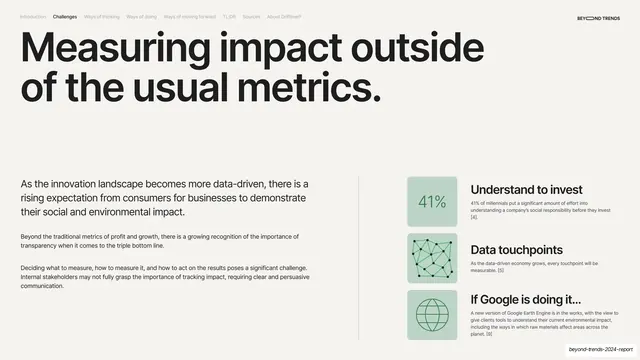
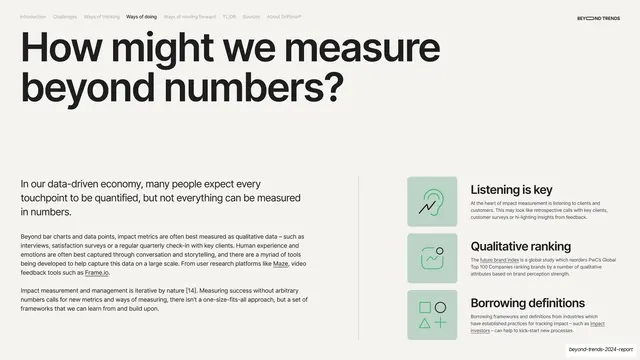
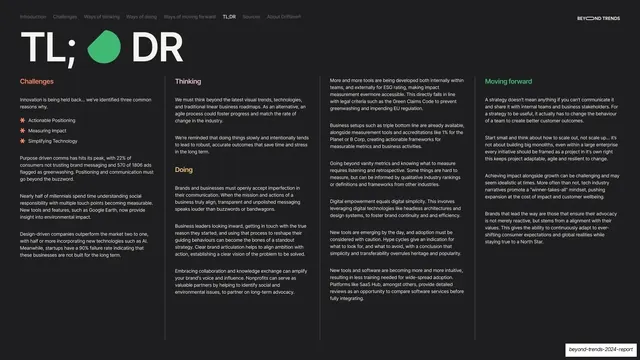
Cream slide on impact measurement, with body text left and three sage-green cards (41%, a node network, a globe) on the right.
Summary
A challenge slide on measuring social and environmental impact: a "Measuring impact outside of the usual metrics." headline with body columns left and three sage-green cards right.
Visual description
Warm cream (#F2F0EB) full bleed, persistent nav (Challenges active), "BEYOND TRENDS" top-right. A large black two-line headline tops the slide. The lower band splits at a vertical hairline: a lead paragraph plus two body paragraphs on the left, and a vertical stack of three sage-green (#A8C8A0) square icon-tiles on the right. The first shows a faded "41%", the second a connected-node network diagram, the third a globe with latitude lines, all in deep green line work. Each tile sits beside a bold label and one footnoted line: "Understand to invest", "Data touchpoints", "If Google is doing it...".
Key takeaway
The same three-card system recolored to a new section accent (green), keeping layout identical while signaling a different topic by hue. The line-art network and globe icons stay simple enough to read at tile size.
Reuse notes
Reuse for any finding backed by a stat, a concept diagram and an example. The single-accent tile color is an easy way to color-code report sections without changing layout. Keep icons to clean monoline shapes so they hold up small.
From this deck: Measuring impact outside usual metrics
View deck






More like this

Keep what you find
A free account saves references to boards and can send you a weekly email of picks based on what you save.
To see every result, go Pro.