Preview image. Unlock full-res
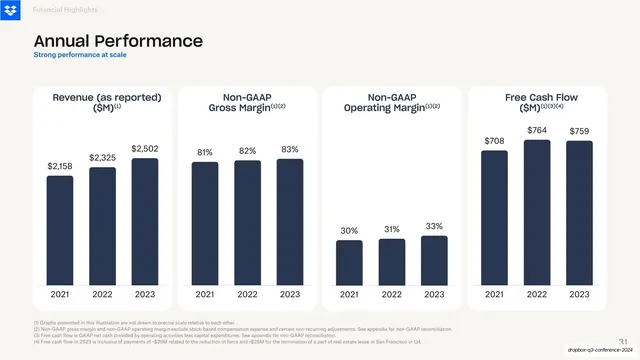
Light financials slide with four side-by-side navy bar charts in soft white cards showing three-year revenue, margins, and free cash flow.
Summary
A light annual-results slide that lines up four small navy bar charts in soft white cards, each a three-year trend for revenue, gross margin, operating margin, and free cash flow.
Visual description
Warm off-white background, Dropbox logo and a muted "Financial Highlights" header at top. A near-black headline "Annual Performance" sits above a small blue subhead "Strong performance at scale". Below, four equal-width soft white cards run across in a row, each a titled three-bar chart for 2021/2022/2023 in dark navy: Revenue (as reported) $2,158 to $2,502M, Non-GAAP Gross Margin 81 to 83 percent, Non-GAAP Operating Margin 30 to 33 percent, and Free Cash Flow $708 to $759M, with value labels above each bar. Four lines of fine-print footnotes run along the bottom.
Key takeaway
The four-up small-multiples row: identical card and bar treatment repeated across four metrics so the eye compares trends at a glance, value labels above every bar, and one shared footnote block keeping all four caveated together.
Reuse notes
The workhorse annual-results layout for an earnings or investor deck. Keeping bar style, card size, and label placement identical across the four charts is the whole point, it makes the row read as one coherent scorecard. Navy bars on white stay neutral; the blue subhead supplies the one editorial note.
From this deck: Annual Performance four-chart row
View deck






More like this




Keep what you find
A free account saves references to boards and can send you a weekly email of picks based on what you save.
To see every result, go Pro.