Preview image. Unlock full-res
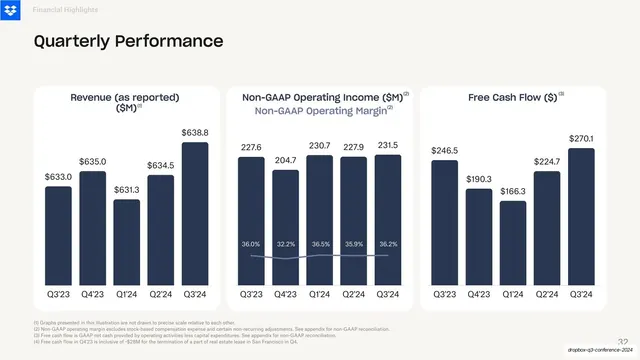
Light financials slide with three navy bar charts in soft white cards tracking five quarters of revenue, operating income with a margin line, and free cash flow.
Summary
A light quarterly-results slide with three navy bar charts in soft white cards covering five quarters of revenue, operating income paired with a margin line, and free cash flow.
Visual description
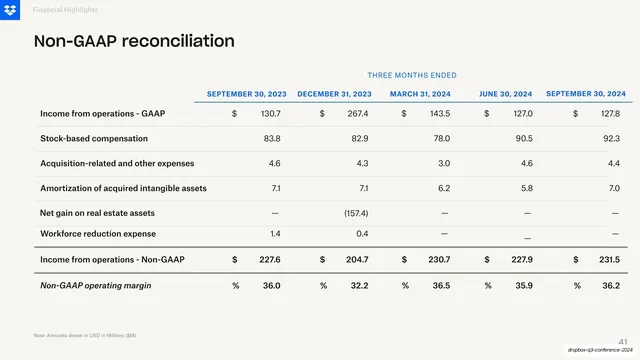
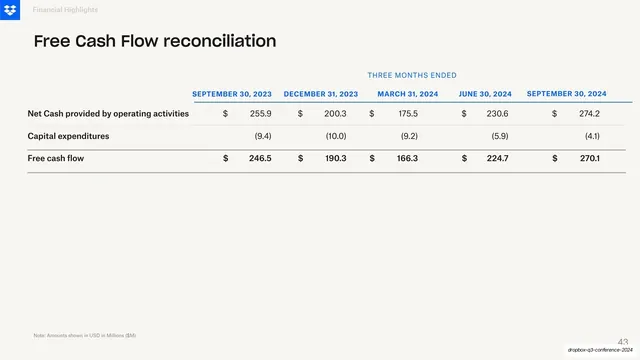
Warm off-white background, Dropbox logo and muted "Financial Highlights" header at top, near-black headline "Quarterly Performance". Three soft white cards span the row. Left: Revenue (as reported) bars for Q3'23 through Q3'24, $633.0 up to $638.8M. Center: a combo chart, Non-GAAP Operating Income bars (227.6 to 231.5) with an overlaid muted blue margin line labeled 36.0 to 36.2 percent across the bars. Right: Free Cash Flow bars ($246.5 down to $166.3 then up to $270.1). Value labels sit above every bar; four lines of footnotes run along the bottom.
Key takeaway
The three-up quarterly version of the small-multiples scorecard, and specifically the center combo chart that lays a thin margin line over the income bars so a ratio and an absolute both read in one frame without a second card.
Reuse notes
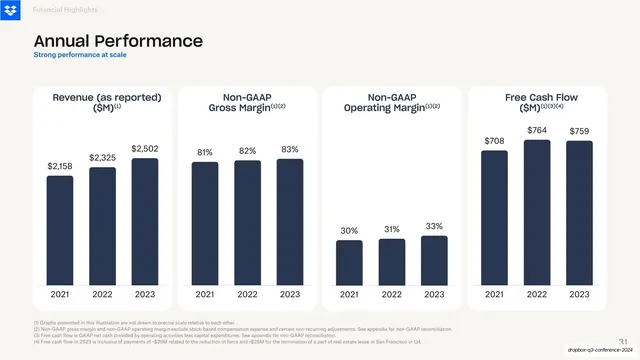
Companion to the annual-results layout (slide 31) at a quarterly cadence; pairing them shows a deliberate annual-then-quarterly rhythm worth copying. The bar-plus-overlaid-line combo is the reusable detail for any "value and margin" metric. Keep the line subtle so it supports rather than competes with the bars.
From this deck: Quarterly Performance three-chart row
View deck





More like this


Keep what you find
A free account saves references to boards and can send you a weekly email of picks based on what you save.
To see every result, go Pro.