Preview image. Unlock full-res
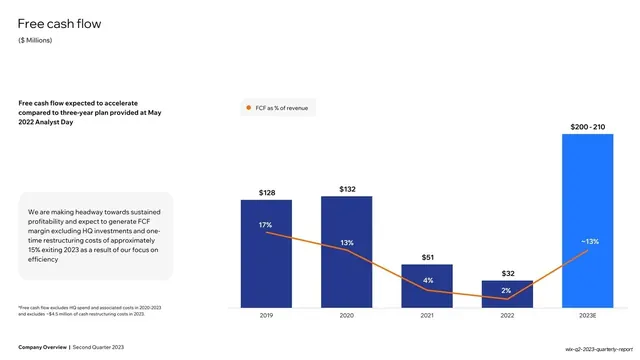
White slide charting free cash flow as navy bars with one bright-blue forecast bar and an orange FCF-as-percent line, plus a grey commentary card on the left.
Summary
A free-cash-flow combo chart: navy bars for 2019 to 2022 plus a bright-blue 2023E forecast bar, overlaid with an orange FCF-as-percent-of-revenue line dipping then recovering, with a grey commentary card on the left.
Visual description
White background. "Free cash flow" headline top-left, "($ Millions)" subtitle. A bold black note about accelerating FCF sits at upper-left; a grey rounded commentary card with a supporting paragraph sits below it. The plot shows navy bars for 2019 ($128), 2020 ($132), 2021 ($51), 2022 ($32), then a taller bright-blue bar for 2023E ($200-210). An orange line tracks "FCF as % of revenue" across the bars (17%, 13%, 4%, 2%, ~13%), dipping in the middle and recovering at the forecast. A small footnote sits bottom-left; bold footer below.
Key takeaway
Marking the forecast year by switching that one bar to the bright accent blue while history stays navy, and overlaying an orange percentage line so the dollar recovery and the margin recovery are both visible in one V-shaped read.
Reuse notes
A clean cash-flow or profitability slide where a dip-and-recovery is the story. Coloring only the forecast bar differently is a lightweight way to flag estimate vs actual. Pairs the grey commentary card and orange-line conventions used elsewhere in the deck.
From this deck: Free cash flow combo chart
View deck






More like this





Keep what you find
A free account saves references to boards and can send you a weekly email of picks based on what you save.
To see every result, go Pro.