
Preview image. Unlock full-res
An appendix reconciliation table inside a dark rounded panel, bridging GAAP net earnings per share to adjusted diluted EPS for two quarters, with footnotes.
Summary
A non-GAAP reconciliation: GAAP net earnings per share bridged to adjusted diluted EPS for two quarters, with share-count rows and numbered footnotes, in the standard dark table panel.
Visual description
A light grey slide with an "Appendix" tab and the title "Reconciliation of GAAP Net Earnings (Loss) Per Share, Diluted to Adjusted Earnings Per Share, Diluted". A wide rounded near-black panel holds the table: a monospace header ("AMOUNTS IN THOUSANDS, EXCEPT PER SHARE AMOUNTS", Q1 2022, Q1 2023), Net Income (Loss) Attributable to Common Stockholders ((101,379) / 16,802), an "Add / (Less):" line with indented stock-based comp, payroll-tax, and income-tax-effect rows, an underlined Adjusted Net Income subtotal (44,713 / 107,401), then weighted-average and adjusted weighted-average share-count rows, and a final Adjusted Earnings Per Share, Diluted ($0.02 / $0.05). Two numbered footnotes about tax rate and dilutive securities sit at the bottom.
Key takeaway
Carrying a per-share reconciliation all the way through the share-count denominator to the final adjusted EPS, with thin rules separating the income bridge from the share rows. Numbered footnotes keep the assumptions visible without crowding the table.
Reuse notes
The most detailed reconciliation pattern here, suited to EPS or any per-unit metric where both numerator and denominator must be reconciled. Use numbered footnotes for methodology. Keep the underlined subtotal and final-result emphasis consistent with the other appendix tables.
From this deck: Adjusted EPS reconciliation table
View deck














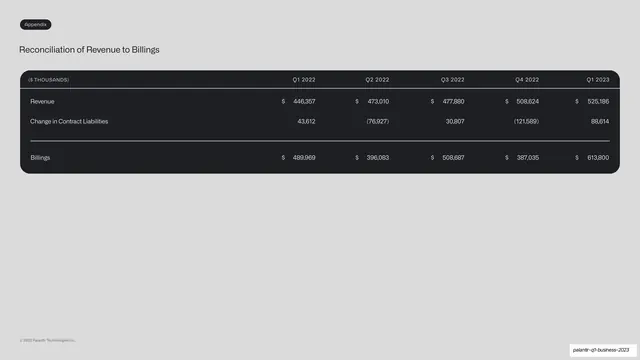
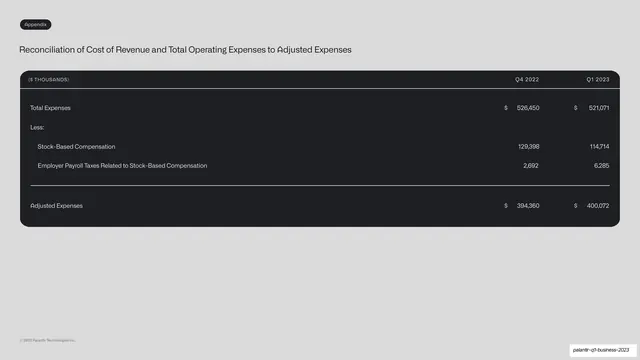
More like this
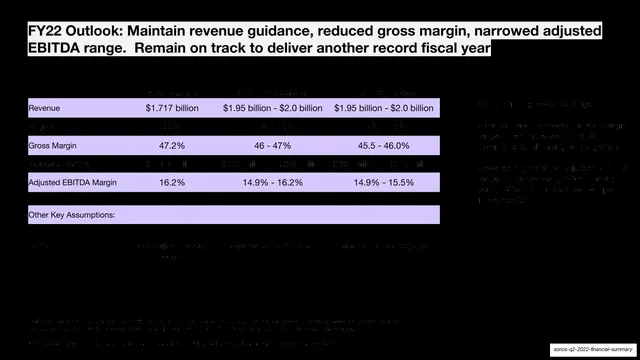




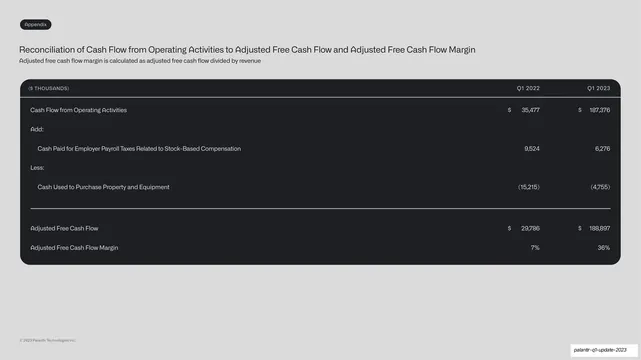



Keep what you find
A free account saves references to boards and can send you a weekly email of picks based on what you save.
To see every result, go Pro.