Preview image. Unlock full-res
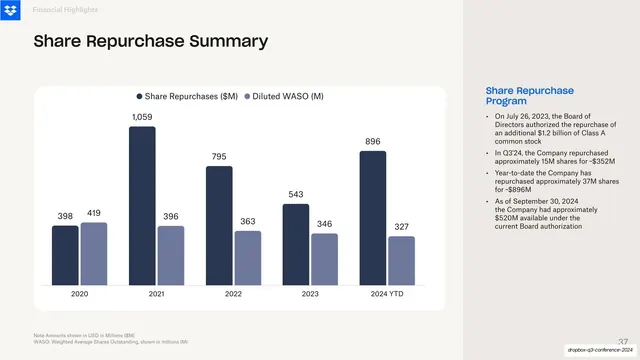
Light financial slide pairing a five-year grouped bar chart of share repurchases with a blue-accented program callout on the right.
Summary
A financial-highlights slide that anchors a five-year grouped column chart of share repurchases inside a rounded white card, with a blue-headed bullet callout summarizing the buyback program on the right.
Visual description
Warm off-white background. Small blue Dropbox box logo top-left next to a faint grey "Financial Highlights" running label. The bold near-black headline "Share Repurchase Summary" sits below. The body is a wide rounded-corner white card holding a two-series grouped bar chart: dark navy bars for "Share Repurchases ($M)" and lighter slate-blue bars for "Diluted WASO (M)", grouped across 2020, 2021, 2022, 2023, and 2024 YTD, each bar topped with its value label (1,059 the tallest). A small dot legend sits above the plot. To the right, a two-line blue heading "Share Repurchase Program" introduces four dark bullet points of program detail. Footnotes run along the bottom left; a faint page number "37" sits bottom-right.
Key takeaway
The pattern of putting the chart in its own soft rounded white card so it reads as a distinct object on the cream field, then parking the narrative as blue-headed bullets in a right rail. Value labels directly on every bar remove any need to read the axis.
Reuse notes
A clean template for investor and financial-results decks where a chart needs an explanatory takeaway beside it. The chart-card-plus-right-rail split scales to any KPI. Restrained navy/slate palette keeps it sober; swap the single blue accent for your own brand color.
From this deck: Share Repurchase Summary grouped bar chart
View deck





More like this





Keep what you find
A free account saves references to boards and can send you a weekly email of picks based on what you save.
To see every result, go Pro.