Preview image. Unlock full-res
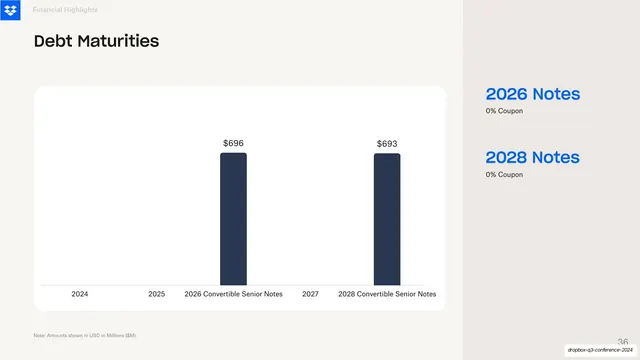
Light financials slide with a two-bar debt-maturities timeline chart in a white card on the left and two blue note callouts in a grey side panel at right.
Summary
A light debt-maturities slide pairing a two-bar timeline chart in a white card on the left with two stacked blue note callouts in a soft grey side panel on the right.
Visual description
Warm off-white background, Dropbox logo and muted "Financial Highlights" header at top, near-black headline "Debt Maturities". A large rounded white card on the left plots a year axis (2024 through 2028) with two dark-navy bars: 2026 Convertible Senior Notes $696M and 2028 Convertible Senior Notes $693M, value-labeled above, empty years between them. The right roughly one-quarter is a soft grey vertical panel holding two stacked callouts, oversized blue "2026 Notes" and "2028 Notes" each with a dark "0% Coupon" line beneath. A single footnote sits bottom-left.
Key takeaway
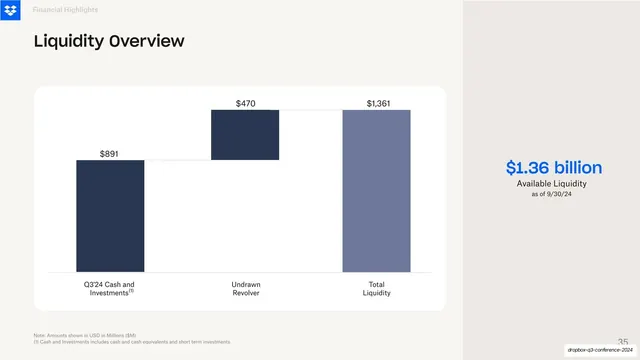
The same chart-left / grey-callout-panel split as the liquidity slide, here reused for debt: a sparse timeline-axis bar chart on the left and the two key facts (the maturities and their 0% coupon) pulled out as blue side-panel callouts.
Reuse notes
Pairs with slide 35 as a matched two-slide capital-structure section; reusing the side-panel callout layout across both is what makes them feel like a set. The empty intervening years on the axis honestly show the maturity timing. Good for any debt, runway, or maturity-schedule slide.
From this deck: Debt Maturities chart with callouts
View deck





More like this



Keep what you find
A free account saves references to boards and can send you a weekly email of picks based on what you save.
To see every result, go Pro.