Preview image. Unlock full-res
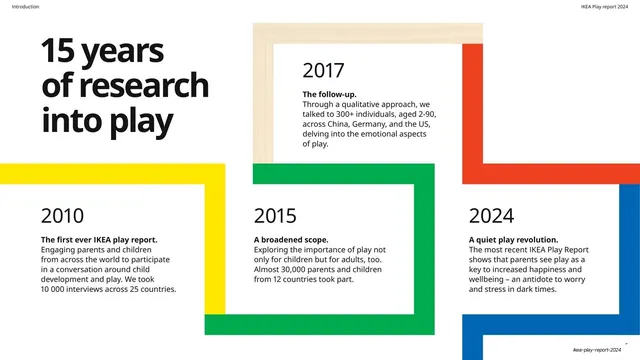
A history timeline built from overlapping primary-color-framed boxes, each holding a year and a milestone, beside a bold black headline.
Summary
A timeline of IKEA's play research, built from overlapping boxes outlined in the brand's primary colors, each framing a year and a short milestone, set beside a left-aligned black headline.
Visual description
White ground. "15 years of research into play" in three lines of oversized black sans-serif fills the upper left. The timeline occupies the rest: thick color-frame outlines (yellow, wood-grain, green, red, blue) form open rectangles that overlap and step across the slide, each enclosing a year and a milestone. 2010 sits in a yellow frame ("The first ever IKEA play report"), 2017 in a wood-grain frame ("The follow-up"), 2015 in a green frame ("A broadened scope"), and 2024 in a blue frame ("A quiet play revolution"); a red frame links them along the top edge. Each entry pairs a large light year numeral with a bold lead line and a short paragraph.
Key takeaway
Making a timeline out of overlapping thick color outlines instead of a single connecting line. The frames link the years visually while the brand palette codes each milestone, turning a dry history into a structural graphic.
Reuse notes
A reusable pattern for a company history, roadmap, or research-lineage slide. The overlapping-frame device reads well when there are four to six points; more would get noisy. Reserve one frame color per entry and keep the years large and light for hierarchy.
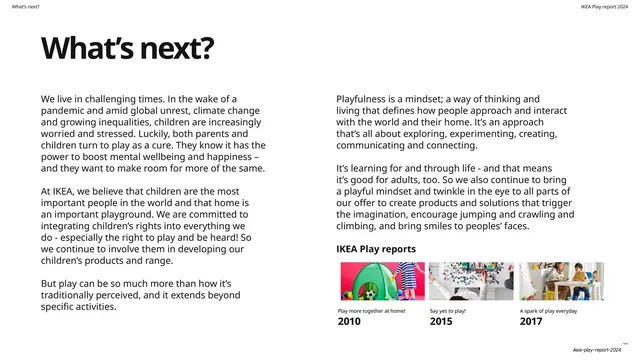
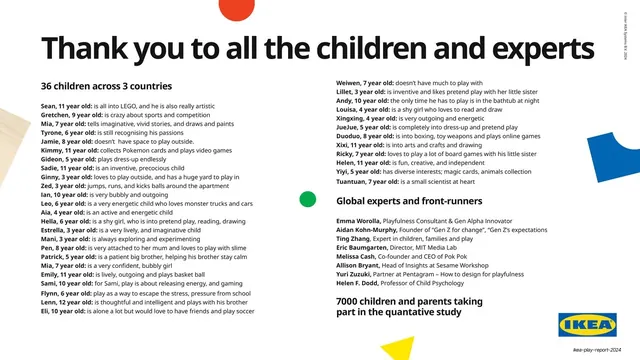
From this deck: 15 years of research timeline
View deck


More like this




Keep what you find
A free account saves references to boards and can send you a weekly email of picks based on what you save.
To see every result, go Pro.