Preview image. Unlock full-res
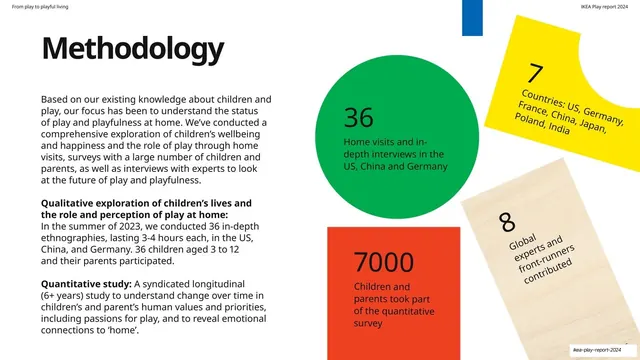
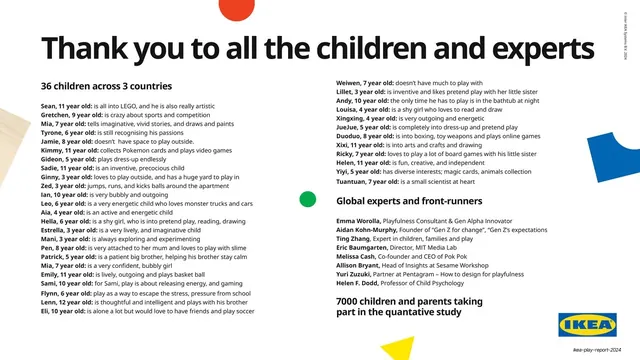
Methodology copy on the left, with four study stats set in scattered primary-color shapes on the right.
Summary
The methodology spread: explanatory copy on the left describing the qualitative and quantitative study, with four headline study numbers set inside scattered primary-color shapes on the right.
Visual description
White ground. "Methodology" top-left in oversized black sans-serif, followed by three blocks of body copy describing the existing knowledge base, a qualitative exploration, and a quantitative study. The right half scatters four stat shapes: a green circle ("36 home visits and in-depth interviews in the US, China and Germany"), a yellow rotated shape ("7 countries: US, Germany, France, China, Japan, Poland, India," text on an angle), a red square ("7000 children and parents took part of the quantitative survey"), and a wood-grain tilted block ("8 global experts and front-runners contributed," text angled to match). A small blue square anchors the top of the cluster.
Key takeaway
Pairing dense methodology prose with a loose constellation of color-shape stats, so the rigor is documented in text while the scale of the study lands instantly through the big numbers. Angling the stat text to the tilt of its shape keeps the collage lively.
Reuse notes
A solid template for a "methodology" or "how we did this" slide in a research report. The text-left / stat-shapes-right split balances credibility and impact. Keep stat copy short so the numbers stay dominant inside the shapes.
From this deck: Methodology with study stats
View deck





More like this







Keep what you find
A free account saves references to boards and can send you a weekly email of picks based on what you save.
To see every result, go Pro.